
(An archive question of the week)
We’ve looked at the basic transformations of a function and how they affect its graph, then at how they combine, and then how they can interact with specific functions. Now let’s look at one problem from beginning to end, looking at a graph and finding the function that goes with it.
Vertical or horizontal stretch?
Here is the question, from 2017:
A Transformational Tour

When finding a function based on its graph, I tend to take the x and y coordinates of a point from that graph and plug them into the equation of the parent graph. I do that to find the constant by which the function's y value needs to be multiplied.

However, I realize that this is only valid if the function involves a vertical transformation. To test for a horizontal transformation, I guess I'd need to divide x by a constant, and plug in the x and y coordinates of any point on that graph.

But how do I know whether to test a graph for a vertical or a horizontal transformation in the first place?
Alex is describing a problem in which he is shown a graph of one of the basic “parent” functions (like a parabola) that has been transformed, and has to determine the transformations of the parent function to obtain the function shown. His initial question relates to what we looked at last time, where both horizontal and vertical stretches might be involved, or they might interact in such a way that it is up to you to decide which to use. I answered:
Hi, Alex.

This is not an "either/or" situation; you can have a combination of BOTH horizontal and vertical transformations, which may also include stretches (or whatever you want to call them) mixed with shifts (translations) and reflections. Moreover, sometimes the same graph can be viewed as either a horizontal or vertical stretch (e.g., for a parabola); other times the two are distinct (e.g., for a trig function). See the first two references below for these two situations.

I'm not sure about a general rule; but like you, I tend to look at the shape of the graph, imagining that I have done any translations and reflections to bring the graphs together around a key point, e.g., a vertex; then looking at another point to find the appropriate scale factor(s).

I've never thought of it this way before, but maybe for any graph with only one key point (e.g., the vertex of a parabola), you can choose arbitrarily between horizontal and vertical stretches, using an arbitrary point to determine the scale factor; while for those with more than one key point (e.g., center point and peak on a sine graph), using two of them tells you about distinct horizontal and vertical scale factors.

But a detailed answer depends on context. Do your graphs have only one transformation at a time? or do you need to deal with combinations? And what kinds of functions are you working with?

In addition to that context (what functions and transformations you have learned), it may be helpful to see a specific example. If your graph is not already online at a web address you can reference in text, please post it on any picture-sharing site, and then give us its URL.
After this I gave links to the pages we looked at last time.
A sample problem
Alex responded with the information I’d asked for:
I'm working with Larson's Precalculus. Section 1.7 has some typical exercises: given one point on the transformed graph, determine what transformations happened to the graph, and what the function is.

Here's an example comparable to what I need to do in my homework assignments (though, as I mentioned earlier, typically I need to figure out whether a given graph contains a vertical or horizontal transformation):

  http://www.mathmotivation.com/lessons/graphs-of-functions-ex4.html

I've learned all the parent functions so far -- including cubic, quadratic, square root, absolute value, constant, reciprocal, and step functions -- but with only one non-rigid transformation per graph. That is, each transformation involves only one type of shrinkage or stretching (though it may involve, say, both a stretch and a shift and a reflection in the x or y axis).
In this context, “non-rigid transformations” are stretches or shrinks (dilations); translations and reflections are “rigid transformations”, which keep the shape unchanged.
The link contains this problem:
Exercise 4 – Finding the Equation of a Given Graph
The graph of y = x2 is shown below. Also, a graph that is a shift, a reflection, and a vertical stretch of y = x2 is shown in green. Use the Function Graphing Rules to find the equation of the graph in green and list the rules you used. Verify your answer on your graphing calculator but be able to explain all the shift rules used.
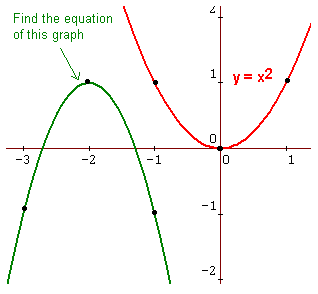
Since the parent function is a parabola, we know from last time that (a) stretches can be assumed to be vertical, since that is equivalent to a horizontal shrink, and (b) horizontal reflections are irrelevant, because the graph has left-right symmetry. That keeps the problem simple.
How to find the transformations
I started with general comments:
Thanks. Since there are a number of slightly different ways to present a problem like this, it's very helpful not to have to imagine what might be "typical." And although what I say about this one will not be exactly what I would do with variant problems, the details will help me show my thinking clearly.

First, I see that you are working with the usual basic functions, and not with things like trig functions (yet). The only one of these for which there is a real difference between horizontal and vertical stretches is the step function; so if we need to do another example, that would be a good one to use. Only in that case would one bother with two stretches in combination.

Second, although here they tell you that they want a vertical stretch, I could have told you that from looking at the graph -- which makes this a good example. You'll see this as I proceed.

Another nice feature of this problem (which is perhaps necessary for a computer-based problem, or more generally when they want to have one indisputably correct answer) is that they have specified TWO points in each graph. Last time, I had called these the "key point" (the vertex) from which shifts and reflections can be determined, together with an "arbitrary point" that can be used to identify stretches. If they didn't provide these, then I would look for such a point myself, which can be a bit of an art! (They really show three points, but symmetry makes the third redundant.)
Something I didn’t say there is that it is not the graphs themselves, but the points shown, that tell me to use a vertical stretch. If they had shown different points, a horizontal compression might have been appropriate. Also, they chose a vertical stretch because, as I’ve mentioned, that is the easier one to use.
If Alex had been working with trigonometric functions, it would be necessary to handle both horizontal and vertical stretches; that was touched on last time, and I’ll be looking at that case later in this answer (and covering trig functions in a later post).
If they had stated the problem in words, it might have read thus:

  The graph of function f is a transformation
  of the function y = x^2 for which the vertex,
  (0, 0) in the parent function, transforms to
  (-2, 1), and the point (1, 1) transforms to
  (-1, -1).

That's all the information you need from the picture.

Now here's how I approach the problem. I'll go beyond just answering your main question of how to decide whether the stretch is horizontal or vertical -- so I can put all the pieces together for you, and you can see what I would do with somewhat different information.
So we’ll pretend they didn’t identify the transformations, and go through the entire process.
First, we'll find the translation and reflection. From a glance at the graph, I see that it is upside-down, so there is a reflection over the x-axis. From the vertices, I see that the graph has been shifted left 2 and up 1. I also know from experience that it's most natural if I think of the reflection and stretches as being done before the shifts. So I have this so far:

  Reflect over x-axis
  Stretch ?
  Shift left 2
  Shift up 1
Notice that I am not doing the transformations in the same order I see them; I have chosen the appropriate order first (based on ideas we’ve seen previously), and then filling in the details as I see them.
Next, to find the stretch, I look at the other point, relative to the vertex. In the parent function, it is 1 unit right and 1 unit up from the vertex; in the new function, it is 1 unit right and 2 units down from the vertex. The fact that both are 1 unit to the right tells me that they are not thinking of it as a horizontal stretch. (That's good, because as I may have said in one of the links I provided, it's easier to handle vertical transformations; so if I had a choice, that is what I would go with.)

The new graph goes down because of reflection over the x-axis; we could have used this to come to that conclusion. The fact that it goes down twice as far as the parent tells us that there is a vertical stretch by a factor of 2 -- that is, y coordinates are multiplied by 2.

So here are the transformations, as determined entirely from looking at
the two given pairs of points:

  Reflect over x-axis
  Stretch vertically by factor of 2
  Shift left 2
  Shift up 1
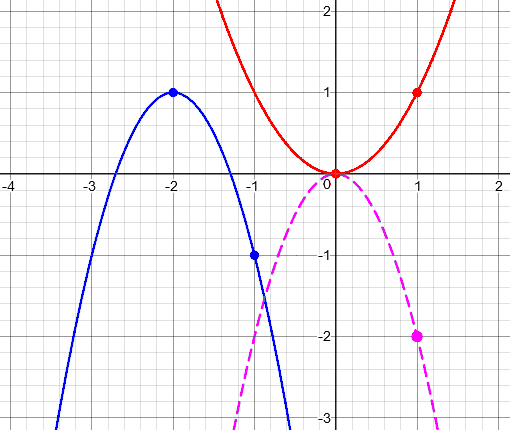
Here are the transformations: red is the parent function; purple is the result of reflecting and stretching (multiplying by -2); blue is the result of shifting left and up.
Now to write the function, I subject the expression to successive transformations in the order listed above. The last link I gave you includes an explanation of the process as I do it, if this is different from what you have learned:

  Original                             y = x^2
  Reflect over x-axis                  y = -x^2
  Stretch vertically by factor of 2    y = -2x^2
  Shift left 2                         y = -2(x + 2)^2
  Shift up 1                           y = -2(x + 2)^2 + 1
So that is our function. Or is it? There was a lot of thinking involved, which means there are a lot of places for possible errors. Therefore …
The last thing I do is to check that my function really gives the graph they show. They ask you to use your calculator; I like to verify not just that it looks right, but that the points given, at least, work out exactly. So I put each given x into my function:

  (-2, 1):    f(-2) = -2(-2 + 2)^2 + 1 = 1
  (-1, -1):   f(-1) = -2(-1 + 2)^2 + 1 = -1
  (-3, -1):   f(-3) = -2(-3 + 2)^2 + 1 = -1

So everything looks good.
Making it harder
This example didn’t include everything that might have happened; if you want to learn well, it can be a good idea to try to give yourself a little extra challenge. I did that here:
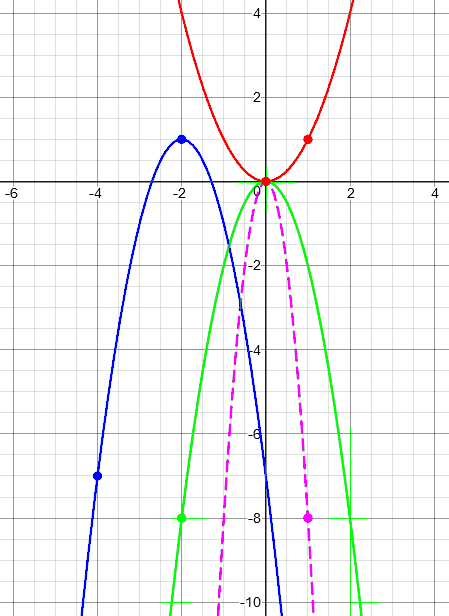
Bonus: If they had marked (1, 1) on the parent and (-4, -7) on the new graph, I might have described it as a horizontal stretch by 2, AND a vertical stretch by 8, and reflections in BOTH axes! (Though textbook authors will never do this to you, see if you can work out why this description would apply; it's a good way to "stretch" your mind!) In that case, my resulting equation would be

  y = -8(-(x + 2)/2)^2 + 1

If we simplify that, we end up with the same result we would get from the answer I gave above, namely

  y = -2x^2 - 8x - 7
Here is a graph showing these transformations (red, vertical stretch to purple, horizontal stretch and reflection to green, shifts to blue):
Now, if they had intended you to use only a horizontal stretch (a compression, actually), they would have had to mark an x-intercept as (sqrt(2)/2 - 2, 0), and the stretch factor would be sqrt(2)/2. Again, you might want to play with this to see how that would work, and how the resulting equation would be equivalent -- but if they ever did this to you, it would be with a nicer stretch factor!

Thanks for the chance to write about this, which I've never done at this level of detail!
We weren’t quite done. Alex wrote back:
Thanks so much! This makes a lot more sense now, but I do have one last question.

You wrote:

  "If they had marked (1, 1) on the parent and
  (-4, -7) on the new graph, I might have
  described it as a horizontal stretch by 2,
  AND a vertical stretch by 8, and reflections
  in BOTH axes!"

I understand why this would be a vertical stretch by 8. However, why exactly is this a horizontal stretch by 2?
I filled in the gap:
Going from (0, 0) to (1, 1) on the original graph, you go right 1 and up 1. Going from (-2, 1) to (-4, -7) on the new graph, you go left 2 and down 8.

The horizontal distance is twice as far (and reversed), so we have a horizontal stretch by a factor of 2 (and reflection over the y-axis). The vertical distance is 8 times as far (and reversed), so we have a vertical stretch by a factor of 8 (and reflection over the x-axis).

All together:

   Original          Transformed

        * ^              2
      /   |1         <-------+
    o     +        +         o
    +--->          |        /
      1            |        /
                   |       /
                   |       /
                   |      /
                   |      /
                 -8|     /
                   |     /
                   |    /
                   |    /
                   |   /
                   |   /
                   |  /
                   |  /
                   v *