Last time, we considered what the normal distribution and the z-score mean; here, we’ll look at some more recent questions demonstrating how to use them. In particular, we’ll see basic examples using a table, and then decide what to do when the right number isn’t there.
Finding values given a probability
We’ll start with a question from the end of 2022, about the problem of finding a value of x given a probability:
I am currently working on Exercise 8.2:
I have already managed to solve Part A and stuck on Parts B and C.
I have also attached the Standard Normal Distribution Table provided by the professor.
Thanks.

We’ll look at the table when we’re ready for it; as we saw last time, there are several different versions of this table, so sharing it was helpful. As we’ll see, the form of Justin’s table explains why he found part (a) easier.
I want to mention that the notation here is a little unusual, using x for the random variable and \(x_0\) for a particular value; more commonly part (a) would be written as \(P(100\le X\le x)\), where X is the random variable and x is a particular value. But we generally work with whatever notation a source uses, to avoid confusing students.
Part a: directly using the table
Of course, we don’t solve problems with no work shown, and no specific questions; but half an hour later Justin added his work:
Here is my solution for Part A:
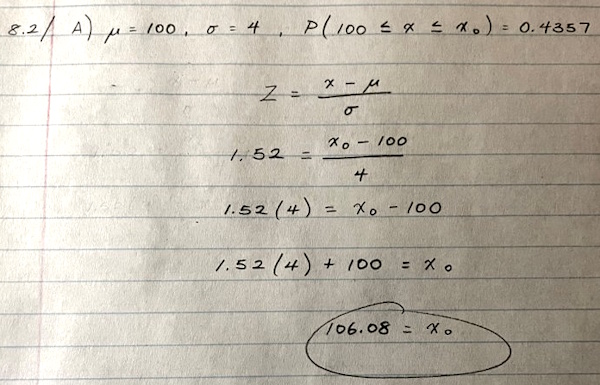
Here Justin first found a value for z based on the probability, and correctly determined the value of \(x_0\) from that. I answered:
Hi, Justin.
Your work for (a) is good; some people derive the formula x = μ + σz rather than solve an equation each time, but either way is good.
That is, he has plugged the given numbers into the equation \(z=\frac{x-\mu}{\sigma}\), while other teachers first solve that general equation for x, obtaining \(x=\mu+\sigma z\) so that the student just has to evaluate rather than solve. These are equally good methods.
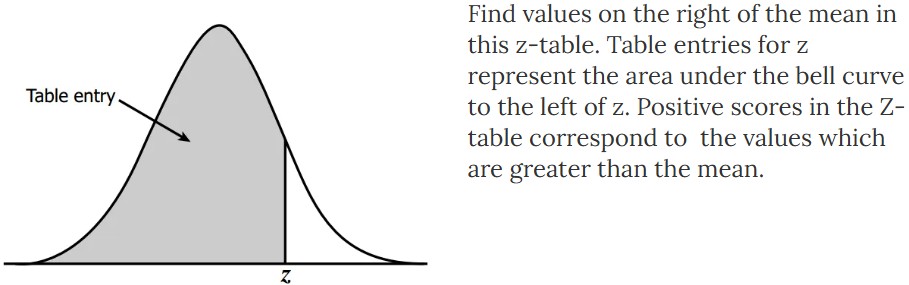
Either way, the first step was to find the value of z corresponding to the given probability. Here is an excerpt of the table:
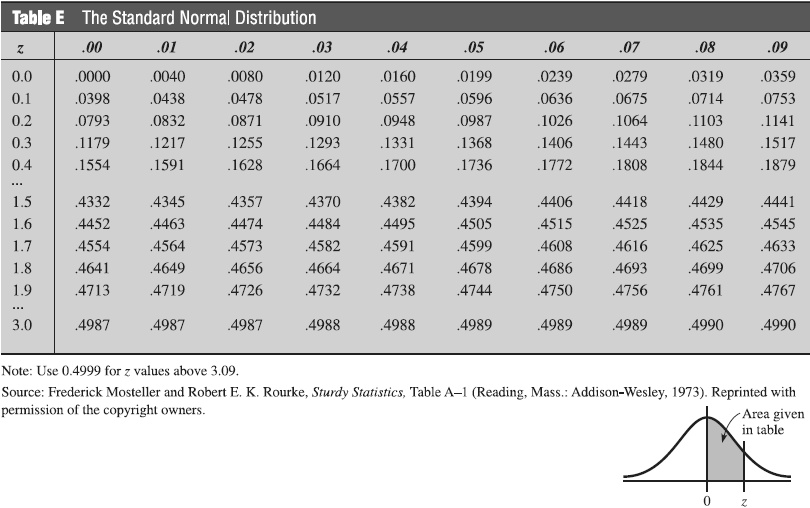
We first notice that the picture at the bottom tells us that the areas in the middle of the table are the areas between the mean and the given value of z, namely \(P(0\le Z\le z)\) (or, in the notation of the problem, \(P(0\le z\le z_0)\)). That’s just what we need, since we were asked about the value of \(x_0\) such that \(P(\mu\le x\le x_0)=0.4357\).
Now we look for that area, 0.4357, in the body of the table:
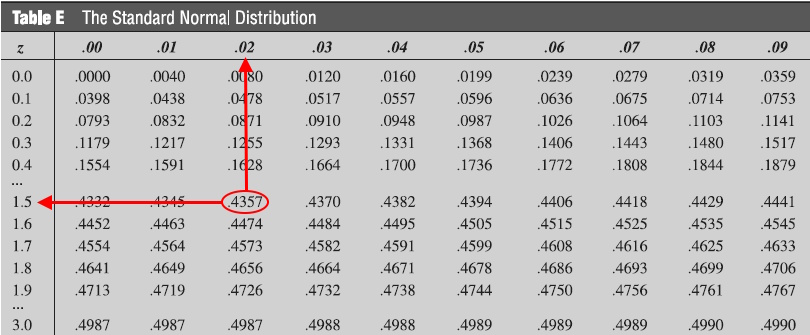
Finally, we read the value of z from the side and top of the table, putting them together to obtain \(z=1.52\).
Matches and mismatches with the table
Everything fell into place there, because it happened that the given probability was exactly what the table is about. (Other tables show different regions.) Subsequent parts will require a little more work from us! I provided some preparation for them:
I’ll give you a couple hints:
For (b), you are told this area:
What is the gray area? Then what is z0? And what is x0?
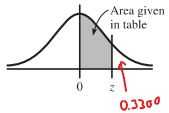
In part (b), we are asked about the value of \(x_0\) such that \(P(x\ge x_0)=0.3300\), which represents the area to the right that I marked, so we need to find the gray area to use the table.
For (c), you are given one value of x (from which you can find z), and the yellow area:
What is the gray area? What is the other part of the yellow area? Can you find the missing z, and then x0?
(I always sketch diagrams like this for such problems.)
Show me whatever work you can do, and I can provide more detailed help.
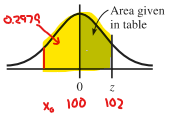
In part (c), we are asked about the value of \(x_0\) such that \(P(x_0\le x\le102)=0.2979\), which represents the area that I marked in yellow, and we need to find the area on the left to use the table. This requires even more extra thought.
Part b: area to the right
Twenty minutes later, Justin sent work for part (b):
Hi, Doctor Peterson,
Thanks for responding to me so quickly.
I think I’m not fully understanding the concepts for Part B, maybe running things by you might help?
The given probability is 0.3300.
The entire area under the curve has a value of one, i.e. representing 100% of the data.
Since P(x ≥ x0) = 0.3300, this means that x must represent the top 33% of the area under the curve.
Conversely, x0 represents the other 67% (1 – 0.3300 = 0.6700).
0.6700 is comprised of the data to the left of μ (0.5000) plus the data from the right side (0.5000 – 0.3300 = 0.1700)
In your opinion, is my understanding correct? I don’t feel like it is, because I still am unsure how to proceed
Do I use the table to find the Z-score for 0.6700? My table only has values up to 0.4990
Look forward to hearing back from you
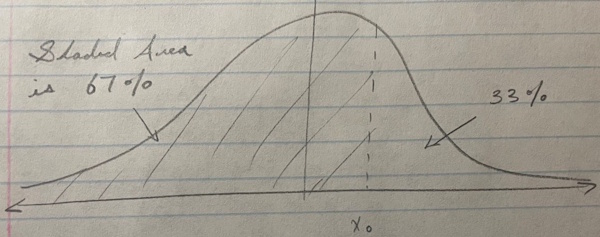
He has come very close, in finding the number 0.1700 but not using it!
I replied an hour later:
I think the fact you are missing (at least in part) is that, because the normal distribution is symmetrical, the area under either half of it is 0.5:
You know this, it seems, but are focused too much on the total area being 1. Or maybe you don’t fully understand what this diagram at the bottom of your table means.
Some tables give the area to the left of a given z, rather than between 0 and z as in yours; with them, you would be looking up 1 – 0.3300 = 0.6700 for (b). In your table, you need to look up 0.5 – 0.3300 instead, which is the gray area. Do you see that?
This is why yours only goes up to 0.4990! It’s only looking at half of the distribution.
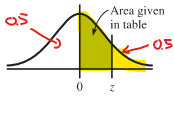
This number \(0.5-0.3300\) is the \(0.1700\) that he found by a slightly longer approach.
An hour and a half later (now after midnight in my time zone), he showed more work, first on problem (b):
Yes, I do understand what you’re saying regarding the table
My table refers to the data on the right-hand side of the curve/distribution. Tables representing the left side would have values beginning at 0.5000
In my case, I need to solve for the Z-score of 0.1700 and then plug that value into the equation
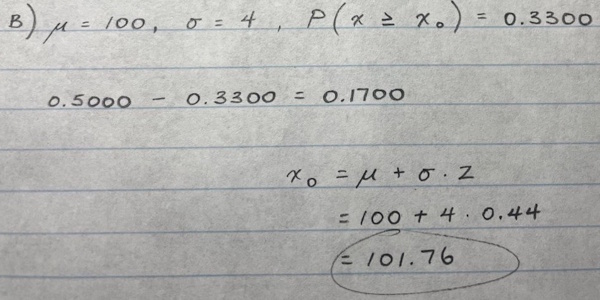
This is good. Here is how the table reads this time:
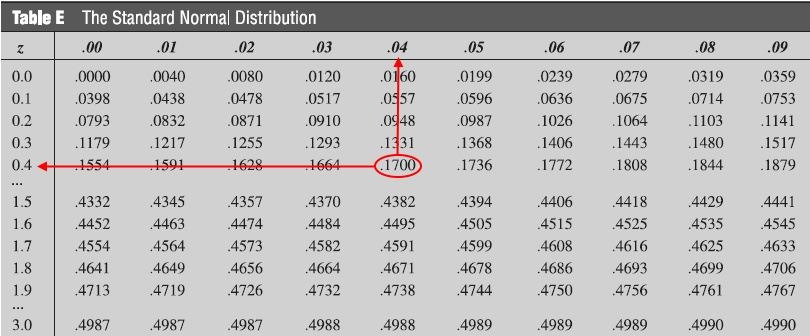
So \(z=0.44\), and x is calculated from that (this time using my alternate method).
Part c: area between two values
Justin continued with work for part (c):
I feel like my understanding of the fundamentals is just extremely weak and that is why I am getting stuck on these problems. Perhaps Part C will be able to show you where my knowledge is lacking. Would appreciate it if you could then help me understand
I have begun the problem by solving for the given value of x = 102
Z-Score = 0.5
Value pulled from table = 0.1915
I assume that I now need to subtract 0.1915 from the given probability of 0.2979, and then use that number (0.1064) to find another Z-Score?
This is just what feels right, I wouldn’t be able to tell you why this should be done — assuming that my idea above is correct
Here he has used the table first in the forward direction, finding \(P(\mu\le x\le102)=0.1915\), and plans to subtract that from the given value for \(P(x_0\le x\le102)\), and look that up as before. He found \(z=\frac{102-100}{4}=0.50\) and used the table like this:
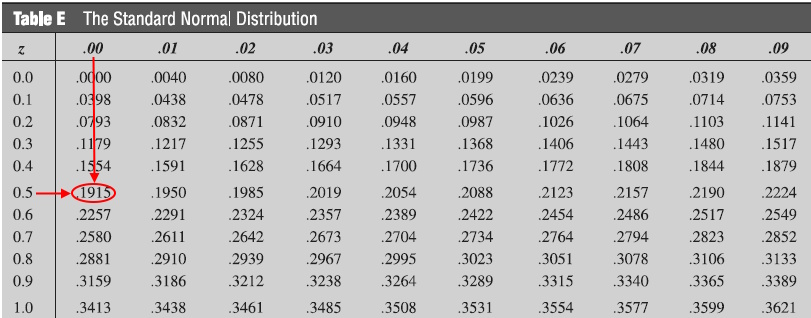
This is all good.
He continued, correctly showing “why this should be done” as he did it:
Here is my ‘understanding’ of the problem, hopefully you can point me in the right direction
Referencing the attached photo, 0.2979 is the probability of any given value for x lying in the shaded area of the curve, yes?
I went and solved for the given value of x, which was 102. I then found the Z-Score of 0.5, and then subsequently pulled the value of 0.1915 from the distribution table. The value of 0.1915 represents the probability of only part of the shaded area, the area from 0 to 102, is that correct?
Since 0.2979 represents the total shaded area, subtracting 0.1915 will give me 0.1064; this new number of 0.1064 represents the other section of the shaded area, x0 to 0. Is this correct?
Then to finish off the problem, I take 0.1064, find the Z-Score for that value, and plug that number into the formula x = μ + σz to solve for the value of x0
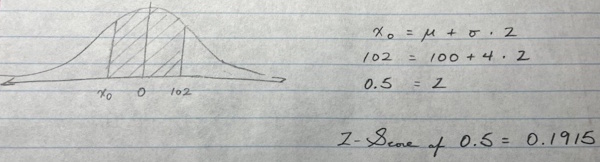
Excellent!
The area between \(x_0\) and 0 will be \(0.2979-0.1915=0.1064\), so he has looked that up:
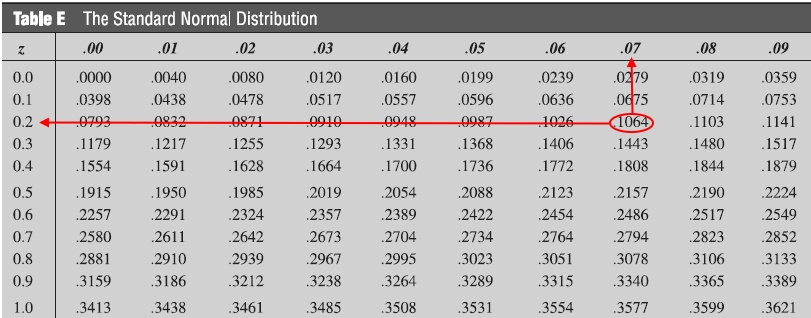
So \(z_0=0.27\). But there’s one detail he hasn’t mentioned, that is necessary in order to finish. I pointed it out:
Everything here is good, too. The one thing you haven’t said is that since this x0 is to the left of the mean, z will be the negative of the value you get from the table. Do you see that?
Justin concluded:
I do see that
Yes, the Z-Score value will be negative as it is to the left of the mean
Thanks for all the help
Since \(z_0=-0.27\), \(x_0=100+4(-0.27)=98.92\). And that’s the answer he presumably got.
One thing that worked nicely throughout this work is that each area we had to look up was right there in the table. That doesn’t always happen, as we’ll see next.
When the number isn’t there: Rounding issues
The next day, Justin asked about another problem where that issue arises:
Working on Part B, quick question regarding my formula setup
Formula is x ± zα/2 * s / √n
α = 0.10
α/2 = 0.05
0.5 – 0.05 = 0.4500
Use attached standard normal distribution table to find the Z-Score for 0.4500
Z-Score of 1.64 = 0.4495
Z-Score of 1.65 = 0.4505
Which do I use, 1.64 or 1.65?
Also, assuming there is one, what is the rule of thumb when the probability value does not exactly match a value from the table? Do we go with the higher, lower, closest, etc.
For example, hypothetically speaking, if the values for the two Z-scores 1.64 and 1.65 were 0.4499 and 0.4502 respectively, which would I use?
Thanks
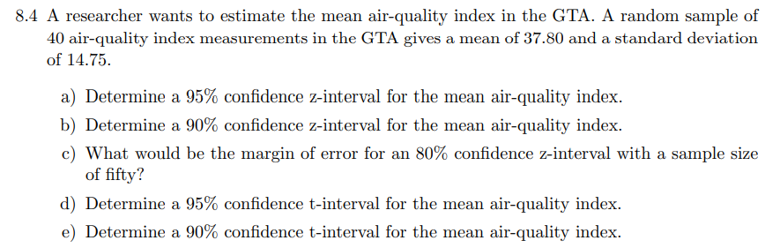
We don’t need to know what GTA means, but since Justin is in Canada, my first guess, Greater Toronto Area, is probably correct.
We also don’t need to discuss confidence intervals now; Justin is asking only about one part of the work: how to find the appropriate value of z to use. This is called \(z_{\alpha/2}\), where \(\alpha\) is the acceptable probability of not being in the interval, 10% in part (b), and means the value of z such that the probability that z is greater than this value is \(\alpha/2\). So we are solving a problem similar to those above, where we want the value of \(z_{\alpha/2}=z_{0.05}\) such that \(P(z\ge z_{0.05})=0.0500\). Since the table gives the area between 0 and z, we are looking for \(P(0\le z\le z_{0.05})=0.5-0.05=0.4500\). (I write the probability with 4 decimal places because that’s what it will look like in the table.)
So we look in the table for that area:
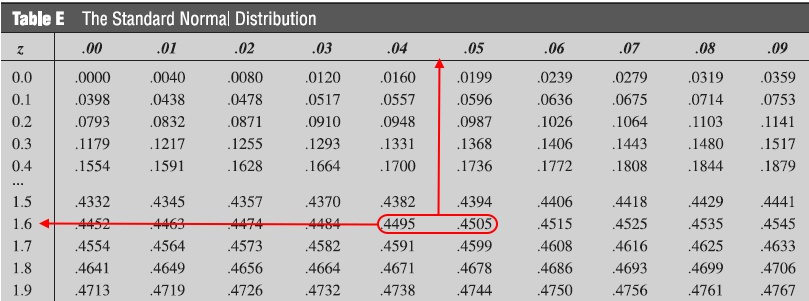
As Justin nicely explained, we don’t find 0.4500 in the table; it’s right between two numbers. So what do we do?
I answered:
Hi, Justin.
I would use 1.645, interpolating, because 0.0500 is exactly halfway. This is commonly recommended; in particular, the tables used by students I tutor have an asterisk between 0.4495 and 0.4505 in the table marking this point, and specify that z0.05 = 1.645 in a separate table of important values.
Interpolation means finding a value in between given values, proportionally. Since 0.5000 is exactly halfway between 0.4495 and 0.4505, we use the value halfway between 1.64 and 1.65. If we use software to actually calculate the value of z directly, we find that it’s 1.644853627…; our interpolated value of 1.645 is accurate to the three decimal places we wrote. (But see below.)
As for the more general questions at the end,
Often your instructor will tell you what convention to use in your class, just so everyone does the same thing. Quite likely that will be to round to the nearest, just for simplicity.
Otherwise, the truly right thing to do depends on the context.
Let’s use a real example, rather than a fake one. Suppose you need the probability that 0 < z < z0 to be no more than 0.3333. Since 0.3333 is between 0.3315 and 0.3340, which correspond to z = 0.96 and 0.97, if you don’t want to interpolate, you need to choose one of those. If you choose the former, then P(0 < z < 0.96) = 0.3315 < 0.3333, so you can be sure it satisfies your requirement. But if you choose the latter (perhaps because it’s closer), then P(0 < z < 0.97) = 0.3340, which is not less than 0.3333, so your requirement is not satisfied. That is, the direction for rounding is implied by the problem, not by which is nearer. This might be taken to imply a rule of thumb for a particular kind of problem, if you want to memorize it. (I haven’t tried.)
But I get the impression that introductory textbooks that make you use a table don’t tend to emphasize such details, because in real life you would use software to do these calculations, which is more accurate and doesn’t require rounding. At this level, the ideas are more important than getting exactly the right answer (based on a rounded value). That’s why they might just say to round to the nearest number in the table (or to always round down or always round up!).
Here is the table for my example:
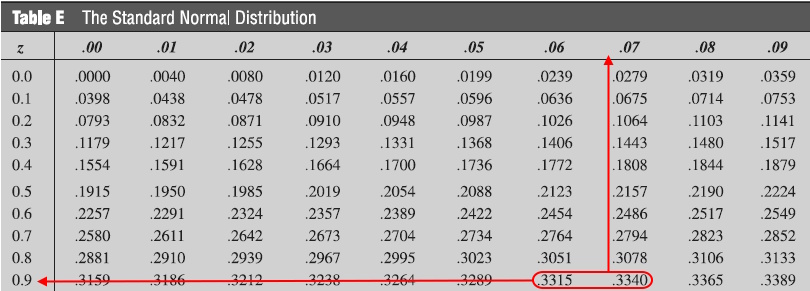
For a probability of 0.3333, we might
- round down to \(z=0.96\) (which is appropriate if we want to make sure that the probability is at most 0.3333), or
- round up to \(z=0.97\) (which is appropriate if we want to make sure that the probability is at least 0.3333), or
- interpolate (if we want to be approximately correct). This means that we imagine that the (cumulative) normal curve represented by the table is essentially linear, so that $$z\approx z_1+\frac{P-P_1}{P_2-P_1}(z_2-z_1)=0.96+\frac{0.3333-0.3315}{0.3340-0.3315}(0.97-0.96)=0.9672$$ That is, because the desired area is about 3/4 of the way from the area at 0.96 to the area at 0.97, we use a value about 3/4 of the way from 0.96 to 0.97.
According to Excel, the correct answer is 0.967288162… . So 0.9673 would be a little better.
But … I was forgetting that the question does have a context! We wanted the 90% confidence interval, which means we want the probability that the actual value is inside the interval to be at least 90%, and the probability that it is outside at most 10%. So rounding down was appropriate in the given problem.
Handling different tables, and rounding
Now let’s look at a question from 2025:
Hi Dr math,
I have the question below:
A store sells clothes, and the profit follows the normal distribution with σ = $30.
If the profit is greater than $285 for every 4 of 5 work days, find μ (the average daily profit).
And I want to check my answer, especially the last row.
It’s z or -z ?
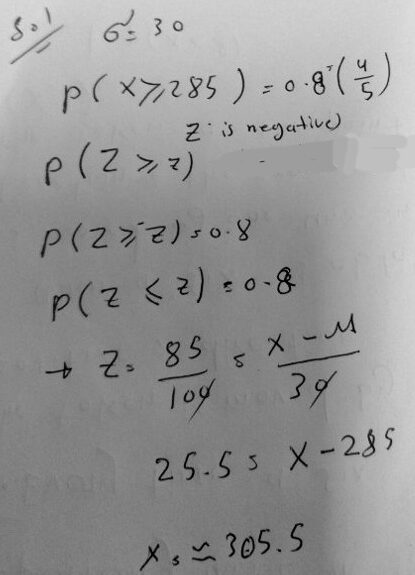
This is a slightly odd problem, estimating the mean of a distribution from an observed probability, assuming the standard deviation is somehow known; but Amia’s question is similar to what we’ve been examining: how to obtain z from a probability that doesn’t match the table. In this case, the main issue is how to handle negatives.
Here is the area that has to be 0.8:
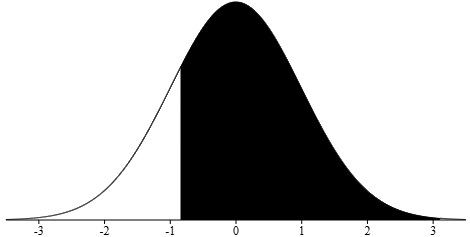
There are some tables that give just this area, but clearly his does not.
I answered:
Hi, Amia.
The last half of your work is questionable, though the answer is correct.
The line “P(Z ≥ z) = 0.8” is appropriate (supposing the tiny minus sign you show is not intentional); the next has changed ≥ to ≤ and removed that sign. I suppose you did intend the sign, and are juggling signs because you want to treat z as positive for some reason. (Do you only have a table for positive z?)
If he did intend to write \(P(Z\ge-z)=0.8\), then he is changing the meaning of z so that the boundary is \(-z\) rather than z; In that case, the next line, \(P(Z\le z)=0.8\), is valid because of the symmetry of the normal curve; the area shown above is the same as this reflected area, using a positive z:
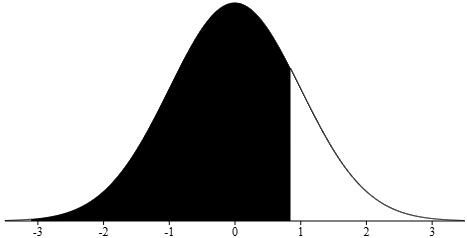
Then you evidently looked up 0.8 in a table and estimated z ≈ 0.85; I find that 0.84 is closer (calculators give it as -0.84162), but you may be thinking about rounding up or down for some specific reason you haven’t stated.
Here is a table that gives this kind of area (\(P(Z\le z)\), showing that result:
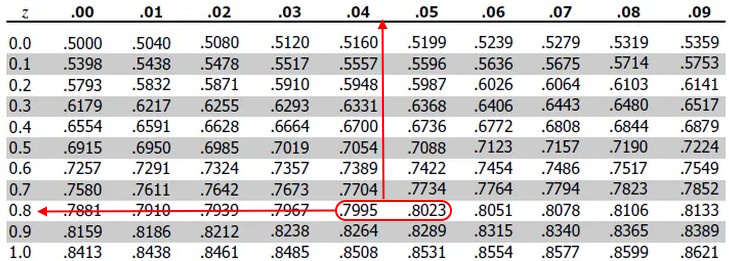
It is closer to round down to 0.84, but Amia has chosen to round up; and if we interpolated, we would get 0.8418.
I proposed an alternative method, not using symmetry and changing signs, but instead using the fact that the area under the entire curve is 1, and using a table showing \(P(Z\le z)\):
Here is what I would do:
P(Z ≥ z) = 0.8
P(Z ≤ z) = 1 – 0.8 = 0.2
z ≈ -0.84 (from table for negative z)
(x – μ)/σ ≈ -0.84
(285 – μ)/30 ≈ -0.84 (note that the unknown is μ, not x)
μ ≈ 285 – 30(-0.84) = 310.2
So your answer, apart from rounding considerations, is correct; but your handling of signs is risky!
Here is the negative part of the table, which I used here:
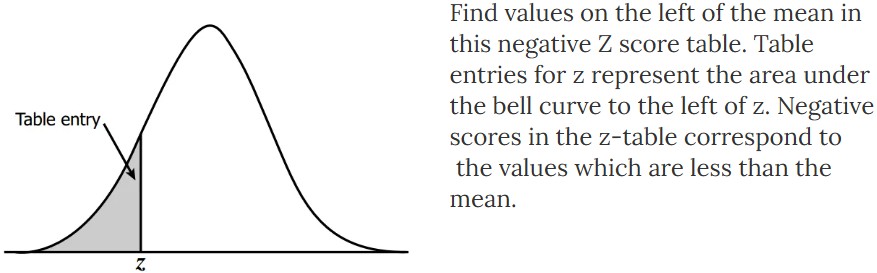
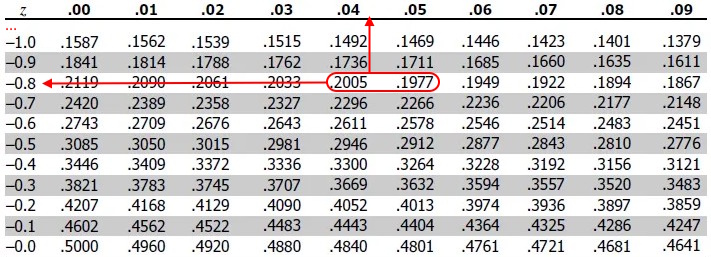
Amia replied:
I don’t have table for negative z.
And the textbook I read from it took the values less or equals. Not the closer.
This brings up two issues: the type of table, and the rounding convention.
I responded to the first line, showing a way to use only the positive table while explicitly using symmetry:
As I suspected. I have seen books with several variations of what tables they have.
In this case, I would modify my work like this:
P(Z ≥ z) = 0.8
By symmetry, this is equivalent to
P(Z ≤ -z) = 0.8 (where -z is positive)
-z ≈ 0.84 (from table for positive z)
z ≈ -0.84
(x – μ)/σ ≈ -0.84
(285 – μ)/30 ≈ -0.84 (note that the unknown is μ, not x)
μ ≈ 285 – 30(-0.84) = 310.2
I assume your book teaches how to handle negative z with the restricted table? It may say to do what I’ve done here, or something else.
In my experience, the kind of table above always comes in pairs (one for negative z, one for positive). It is possible that Amia’s table is like the one we used above, showing \(P(0\le Z\le z)\) (which requires only the positive case, because negative the sign can be ignored); with that table, we would subtract 0.5000 from the given area and look up 0.3000:
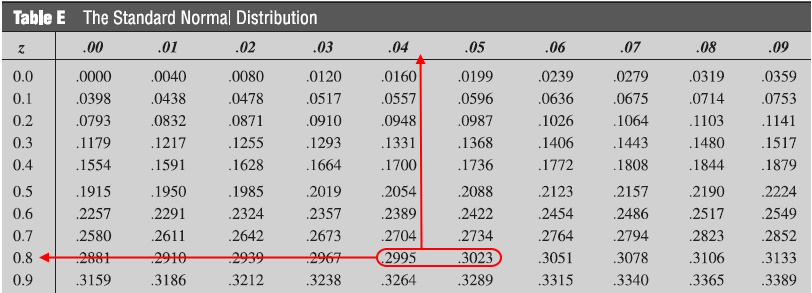
Back to rounding
As for the rounding (the statement that the textbook says to round to the lower value rather than to the nearest):
Again, this is as I suspected. The book my students use tells them to round to the nearest, but I know that some books for problems of this sort will tell students to always round down, or to always round up, probably to keep things simple. Others may ask for interpolation, to get more accurate results. And, of course, in reality one would use technology that gives even more accuracy, as I used to get -0.84162. (That’s probably one reason that modern courses don’t emphasize how to get maximum accuracy from tables: It isn’t needed in real life.)
But Amia actually rounded up, not down. I never asked about his thinking there.
In reality, one should make this decision based on the needs of the problem. In our case, the goal is to find μ as accurately as possible, so I would prefer my approach of rounding-to-nearest. But if we wanted to be sure that our answer did not overestimate the mean, we would want to say that “μ ≥ something”, so we would want to know that “z ≤ something”, so we would round up (because if we claimed that z ≤ -0.84, when it is really -0.84162, we would be wrong). That’s hard enough for me to convince myself of, much less a student! (I hope I said it right!)
I don’t know why one would want to avoid overestimating; that’s just a hypothetical reason.
Amia showed what his book said:
The book deals with z as follows:
z should be negative (from the question details)
P(Z ≥ z) = 0.8
P(Z ≤ z) = 0.8
From the table, z ≈ 0.84
Since z we want, which is connected to x, should be negative,
-0.84 = (285 – μ)/30
μ = 310.2
I answered,
And that, of course, is essentially what I said this last time, except that it changes the meaning of z halfway through, first obtaining +0.84, and then changing it to -0.84 with only a verbal explanation. I prefer my approach, which keeps the same definition for z throughout, rather than saying it is negative but then getting a positive value! But students learning a routine method may not notice (while very good students may be bothered, as I would, by the inconsistency).
Note that they did round to 0.84, whether that means rounding down or to nearest, though that meant, in effect, rounding up the negative value \(z=-0.84\).