
(A new question of the week)
Real life questions of probability often require information that we don’t have – they become a job for statistics instead. But sometimes just trying some plausible numbers, as in a Fermi problem, can yield interesting results. Here we consider the probability of an injury when kids play near a baseball field. Then we’ll jump from that to an older question about masks and COVID, using actual data. In both cases, we end up looking at long-term risks.
How likely is it that a child will be hit?
The first question I want to look at came in late June:
Hi,
We have a play park right behind our baseball field.
The play park is about 16 000 sq ft.
The city wants to close the baseball field because they are afraid a child will get hurt.
What are the possibilities of a softball hitting a child in this area with a home run?
I’d say a child occupy 4 sq ft and a softball might be .10 sq feet?
To visualize this, suppose that the baseball field extends about 300 feet in each direction from home plate at the lower left corner (bases being 90 feet apart), for a total of 90,000 square feet, and the play area measures 300 by a little more than 50 feet. Here is a possible layout:
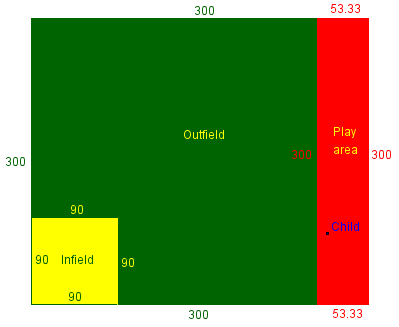
We don’t know the actual shape or placement of the play area, so this is just conceptual. I didn’t make such model before answering, and in fact envisioned the play area being closer to the size of the ballfield, with only part being near the outfield. What I’ve drawn here is perhaps the worst case.
I answered, skeptical of the whole question:
Hi, Michael.
A question like this really can’t be answered without statistical data, such as how many children are in the park during a typical game, the distribution of locations where home runs will land, and more.
These missing details are very important in reality. If the play area were packed solid with children, and if batters habitually hit home runs over the fence, the situation would be far worse than if there were one kid sitting at the far corner, and children batting who could barely hit into the outfield!
I started out just trying to demonstrate these ideas by making up some totally arbitrary facts that would be somewhat plausible:
For example, suppose that during a game you can expect 10 home runs that would land in the play area, which would be uniformly distributed over half of that area (the other half being too far away). And suppose that there are 20 children uniformly distributed over the entire play area during the game.
Then we could estimate (roughly) that children take up about 20 4-ft2 patches out of 16 000/2 = 8000 ft2, consisting of 8000/4=2000 such patches, on which a ball might land. So the probability that any one ball would land on a child would be 20/2000 = 0.01 = 1%.
The assumption of half the play area being too far away to be hit is not reasonable based on my drawing, but seemed so at the time; and I mostly wanted to illustrate the idea of a (non-uniform) distribution. The suggested size of a child is probably too large based on a top view, but perhaps too small considering the ball would be coming in at an angle. My calculations suggest that children might take up about 1/2000 = 0.05% of the area the ball might hit, so that each ball that reaches the play area has that much chance of hitting one. With each child on a different spot, the probability of the ball hitting someone is \(20\times0.05\%=1\%\). (It was entirely by chance that my randomly chosen numbers worked out so nicely, but that motivated me not to adjust them!)
Out of 10 such hits, the probability that none would hit a child would be 0.99^10 ≈ 0.90 = 90%. So the probability of a child being hit during a given game would be 10%. If there were 100 games during a season, the probability of no child being hit becomes 0.90^100 = 0.000043, and the probability of at least one being hit would be 0.999957 – almost certain.
That 1% sounds like a small probability; but for something you really, really don’t want to happen, you need to take into account how many opportunities there are. My proposals of 10 long hits per game, and 100 games per season, are probably too high, but … it made a point. (With only 5 hits into the play area per game and 50 games per season, the probability becomes \(1-0.99^5=0.049=4.9%\) per game, and \(1-0.951^{50}=0.919=91.9%\) for the season, which is still significant.)
I didn’t do this as a serious answer to your question, because my assumptions are intended only as wild guesses, and probably contrary to fact; but it interestingly demonstrates that the probability can increase considerably as the number of opportunities increases!
I was expecting a small chance, but instead I think I’ve shown why they would want to be cautious. Not allowing games when children are present, or not allowing children during games, might be very reasonable, IF there are many hits into a large enough part of the play area. Those are the sort of statistics you’d need to gather. Has a hit ever gone into that area in the past? How often?
Questions of safety can be tricky. The real probabilities may well be too low to be a major worry, but we’ve seen enough to want to be cautious, and gather the additional data – or just make small changes to the rules.
Michael didn’t reply, but did indicate that the answer was helpful.
How risky is a loose mask?
That question about risk reminds me of a question from last December, from Laura in Germany:
I am wondering about the probability of getting infected with COVID when you wear a mask. A recent study said that if you wear a good mask but it’s not tight around your nose, the probability of getting infected if you are with an infected person for 20 minutes is 4%. (There are more details but that would make this too long). That seems like a small risk to me. But my husband said I have to add the risk for every time we meet people. So if we go shopping once a week it would be 4% times 52 weeks after a year. A very big risk. That seems crazy to me. But he’s a scientist so he’s probably right. Can you clarify?
This gives us another chance to do the same kind of calculation we did above, and to dig in a little deeper: How do you find the long-term risk when you know the risk for each exposure? How much is it affected by changes in parameters?
This time we have real statistics to start with.
I answered:
Hi, Laura.
The details you are ignoring may change the ultimate conclusions considerably; but I’ll just look at your specific question.
We will assume that each week you spend enough time close enough to one infected person that the probability that you will catch the infection on that occasion is 4%.
Your husband is wrong about the specific calculation to determine the probability of being infected in one of 52 such incidents; you can’t just add probabilities. (In particular 52*4% = 208%, which is impossible as a probability! The highest a probability can be is 100%, which is 1.) But the probabilities do “add up”, figuratively.
The calculation he suggested was a rough first estimate, which we can fix:
Here’s the correct calculation (again, assuming the data are correct):
The probability that you will get infected at least once is 1 minus the probability that you will not be infected on any of the occasions.
The probability that you will not be infected on any one occasion is 1 – 0.04 = 0.96 (that is, 96%). The probability that this will happen 52 times in a row is (0.96)52 = 0.1197.
So the probability that you will be infected at least once in the year is 1 – 0.1197 = 0.88 (that is, 88%).
Let’s turn this into a general formula. Suppose that the probability of “success” (which in our case means getting sick!) at any one “trial” is \(p\). Then the probability of “failure” is \(1-p\); and if the trial is repeated \(n\) times, the probability of failure every time is \((1-p)^n\). The probability of at least one success is the complement of no success, namely \(1-(1-p)^n\). Here is a graph of this in our case, with \(p=0.04\), as \(n\) increases up to 104 (two years of weekly events):
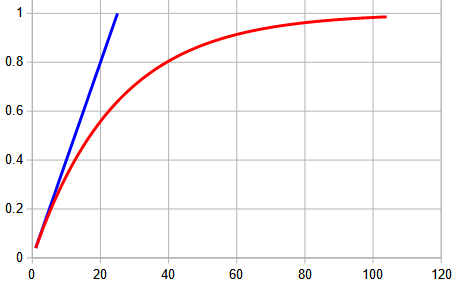
The blue line shows what would happen if we just multiplied by \(n\), using the naïve guess about the effect of repeated exposure. Reality looks quite different, but still rises inexorably.
So, yes, the probability increases with each exposure; and it does eventually get quite large. If you had provided the article, I might be able to check out other mathematical issues in it, but I’m sure we both know there are a lot of complexities to be kept in mind. In particular, I doubt that you spend 20 minutes that close to any one person at the store. But that’s not my area of expertise.
We’ll see the article in a moment.
Reality
Laura replied:
Thanks so much. I can send a link to the study if you are interested but it’s in German (at least the link I have). I agree that in reality the risk would be much smaller. In the study itself, they say that under real conditions the risk would be 10 to 100 times smaller!
I was interested in the risk calculation in theory. I didn’t realize one needed to add them at all. That applies to all areas of life, then. Driving, for example. Kind of scary.
So the study’s numbers are very conservative, even given the assumption of spending 20 minutes with a contagious person. We should be concerned, but not terrified (as long as we are masked!). And, yes, that’s true for all of life. Everything we do has some risk, and if we do anything often enough, the risk adds up. We have to make decisions based on how serious the consequences are (for ourselves and others), and avoid doing risky things too often.
I answered:
Yes, risks “add up” when you do anything enough times. Though it isn’t literal addition, it does grow.
On the other hand, the same can be said of benefits!
Just to take this one step further, if the risk was really 0.4% per occasion, 1/10 as much, then after 52 times, the total risk would be 1 – (1 – 0.004)52 = 0.188 = 18.8%.
It could be interesting to see the study, though there are enough of them around. If you feel like it, send me the link and I’ll at least let Google translate it for me (though I did take German in college many years ago, and so did my daughter).
Here is the graph for this 0.4% risk for a poorly fitting mask:
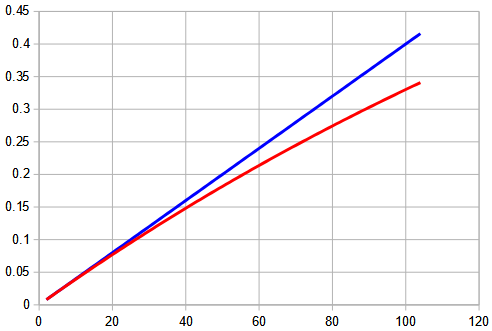
At such a small probability, the increase is much closer to linear (that is, to literally adding up); after two years, it is still less than 35%. This illustrates how modifying the assumptions can affect our results.
Now think about what I said about the benefits also adding up. Since wearing a good mask reduces the probability of getting sick on one occasion considerably, it is even more valuable over multiple exposures, and more so when more people wear them. So is vaccination. Every measure you take helps. In particular, I’m reminded of the Swiss Cheese Model.
Laura wrote back:
Hi Doctor Peterson. I figure I can just summarize the study in a few sentences. (By the way: I live in Germany which is why I am reading studies in German). This one is from the Max Planck Institute (Eberhard Bodenschatz). They say that if you wear a FFP2 or KN95 mask (I don’t know if you call them that in the US), and you have an infected person and a healthy but unvaccinated person in close proximity indoors, the risk of the healthy person getting infected after 20 minutes is 0,1% — if the mask is worn properly — ie if the metal thing is pushed tightly against the nose. If the mask isn’t worn properly, the risk rises to 4%. If you wear the normal surgical mask (the blue ones — at least here they’re blue), the risk is 10%. And if you wear no mask at all, the risk is 90% after only a few minutes, even at 3 meters distance. The researchers stress, however, that the estimates are very conservative. In normal life situations, the risk is “surely” 10 to 100 times less.
It’s worth noting that while our original question was about why a 4% risk is not as low as it seems, the point of the article is that even a poorly worn mask is better than none, and a well-fitted mask is far more effective than the researchers expected.
Thinking about your answer about adding up risks (I know: not literally adding up), it makes perfect sense. If I drive drunk once, I might be OK but if I drive drunk often — bad idea. I just hadn’t really thought about it. We talk a lot about the fact that normal people are so unaware of statistics (I don’t think it was taught in school at my time) and how important it is. I will keep trying to inform myself!
Apart from the mathematical details, what we’ve been discussing about repeated risks should be common sense; but it is easy to overlook!
I replied:
Thanks. A quick search turned up this article that appears to be an English language version of the same report:
https://www.mpg.de/17916867/coronavirus-masks-risk-protection
I work in a tutoring center at my school, which requires everyone to be masked, and we sit (mostly) on opposite sides of wide tables. But many people wear surgical type masks very loosely, and I often wonder what good it is to require masks at all. But the article does say, “Surgical masks already reduce the amount significantly, even if they fit poorly.”
Maybe in addition to “risks add up”, we should add, “any reduction can help.”
The actual article
Here are some quotes from the article:
The Göttingen study confirms that FFP2 or KN95 masks are particularly effective in filtering infectious particles from the air breathed – especially if they are as tightly sealed as possible at the face. If both the infected and the non-infected person wear well-fitting FFP2 masks, the maximum risk of infection after 20 minutes is hardly more than one per thousand, even at the shortest distance. If their masks fit poorly, the probability of infection increases to about four percent. If both wear well-fitting medical masks, the virus is likely to be transmitted within 20 minutes with a maximum probability of ten percent.
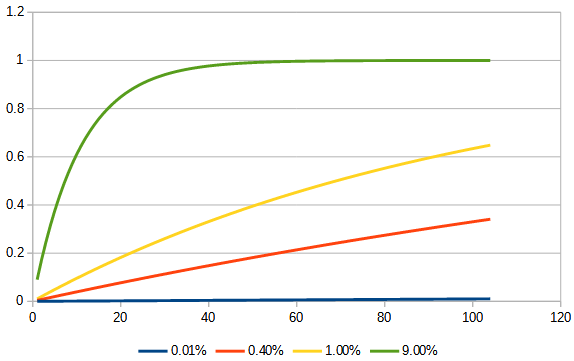
Here is our graph for all four cases (using their conservative numbers):
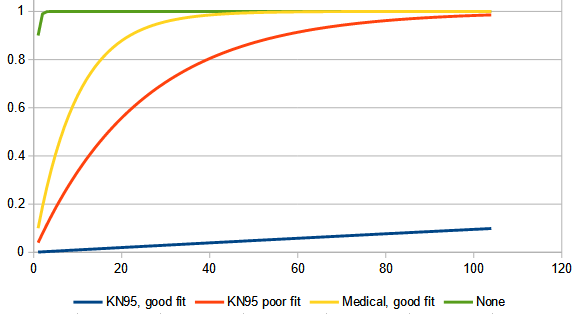
As before, the horizontal axis is the number of 20-minute interactions, and the vertical is the probability of at least one infection. A good fit makes a big difference.
The infection probabilities determined by the Max Planck team indicate the upper limit of the risk in each case. “In daily life, the actual probability of infection is certainly 10 to 100 times smaller,” says Eberhard Bodenschatz. This is because the air that flows out of the mask at the edges is diluted, so you don’t get all the unfiltered breathing air. But we assumed this because we can’t measure for all situations how much breathing air from one mask wearer reaches another person, and because we wanted to calculate the risk as conservatively as possible,” Bodenschatz explains. “Under these conditions, if even the largest theoretical risk is small, then you’re on the very safe side under real conditions.”
Here is our graph for all four cases assuming the probabilities are 1/10 of their worst case:
Even here, without a mask, a year of weekly interactions lead to almost certain infection; a well-fitting KN95 gives impressive protection.
Although the detailed analysis by the Max Planck researchers in Göttingen shows that tight-fitting FFP2 masks provide 75 times better protection compared to well-fitting surgical masks and that the way a mask is worn makes a huge difference; even medical masks significantly reduce the risk of infection compared to a situation without any mouth-nose protection at all.
Laura responded:
Cool. And thanks for the English link. I can think of a few people who might be interested in it. I know plenty of teachers, for example. (Although: maybe they would be annoyed — hmmm… have to think about that one)
The fact that masks worn tightly is so efficient is good news to me. That means that in highly uncertain situations, I can wear one and feel quite safe. And the fact that loosely worn masks help somewhat is good news too. It means I can feel fairly safe then too. Like just running into the drugstore quickly.
The COVID era is teaching lots of us about math and statistics. Exponential growth is a good one. For most of us that was just a theoretical idea until now. Suddenly it is really important to understand.
Anyway — I’m glad I discovered this site. I’m pretty sure my husband knew you don’t add up things literally but we were in an argument so he probably fudged a bit to try to convince me. Ah, life!
Until my next statistical emergency!
Laura
There is certainly far more that could be said in practical terms, given more data; but our goal here is just to think about how short-term risks become long-term risks, not to decide policies or judge the accuracy of a study. As I said two years ago, our goal is to illustrate math, not to analyze reality.
Hello Dave,
I will appreciate your response to this aspect of probability that I have been thinking about for a while ?
I would like to pose a question to you about probability.
The easiest way I can pose my question is to invent an example of it and that’s what I’ve done here:
1) Imagine we have a machine that can randomly generate the numbers: 0,1,2,3,4,5,6,7,8,9. (That is the numbers 0 to 9 only).
2) The machine only generates the numbers one at a time and it’s a perfectly random generation, that is, the probability of any one of those numbers being generated is the same, being 1 in 10 (1/10) for each generation.
3) In this example, we begin by turning the machne on and we will generate 10 numbers one at a time (and as explained above the machine only radomly generates numbers from 0 to 9).
4) We let the number generate the first 4 numbers. In this example I will just make up any 4 numbers, so let’s just say the first four numbers generated are: 3,8,5 and 0 in that order.
My question is: Is it reasonable to expect that there is a greater likelihood that the 5th. number generated randomly by the machine will be a different number to the first 4 numbers ?
In other words, since the first 4 numbers generated (in this example 3,8,5,0) have had their ‘turn’, isn’t there a better-than-even chance that the 5th. number is more likely to be one of the numbers that hasn’t come up already ? That is, either: 1,2,4,6,7 or 9 ?
I want to reiterate the original condition that the machine generates randomly, that is, each number has a probability of 1 in 10 of coming up in each number generation.
My feeling is that as we continue along generating the 10 numbers, there is always a greater likelihood that the next number that comes up will be a number that hasn’t come up already. That is not to say that all of the numbers are going to come up in 10 ‘generations’ – there could be all kinds of combinations etc, but since each number has the same probability of coming up on each ‘generation’ doesn’t it therefore follow that if a number hasn’t already come up it’s more likely to come up next time than a number that has already come up ?
I know how to calculate the probability of the 5th. number being different from the first 4, but as we go along it get’s more complicated doesn’t it ?
Is there a formula you can suggest to calculate what are probabilities, as we go along generating the 10 random numbers one after the other, that the next consecutive number will be a different number than the one(s) already generated ? And bearing in mind that there could be duplicates or more of the same number or numbers being generated.
Thank you and best regards,
Geoff S.
Sydney, Australia
Some of what you say is probably not what you mean; and some of it flirts with what we discuss in The Gambler’s Fallacy. There is more to be said than I can say here.
Comments are not the place to ask elaborate questions that may require extended conversation. That is why we have the Ask a Question page. If the discussion we have there is interesting, it may become a subsequent blog post.
Okay Dave.
I will endeavour to re-write my question succinctly and submit it to your Ask A Question page as you requested.
Thank you and best regards,
Geoff S.
Sydney, Australia
Please check your spam folder to see if my response to you is there. I already submitted your question to us, and gave a preliminary answer that you have not read.