
A recent question about two interpretations of the range of a data set in statistics leads us into some older questions and some mysteries. Is “range” defined as the interval containing the data, or the difference between largest and smallest values, or 1 more than that? Yes! All three are used, and are useful.
What is range? Mathematical and other usage
I’ll start with a question from 2003:
Definitions of Range

I can find only one definition of range in the math dictionaries - the difference between the smallest and the largest number in a set.  We are always talking about "They range in age from, or they range in height, or they range in weight, or they range in size, etc.".  If the only definition of range is the difference, why do we say "They range..."?
The range of a data set, such as \((72, 76, 76, 84, 89, 90, 94)\), is the distance between the ends, in this case \(94-72=22\). (If you think that’s wrong, we’ll get to that soon …)
The anonymous student finds only this definition, as a noun, in math dictionaries; why don’t they say what it means as a verb? And isn’t the fact that the values range from 72 to 94 more important than the mere difference?
I answered, starting with a definition from a standard American English dictionary:
Thanks for writing to Dr. Math.
Math definitions generally give only the specific technical sense of words; your use of "range from this to that" is a common-language sense, which can be found in ordinary dictionaries, and doesn't need a special definition. In fact, if you look up "range" in, for example, Merriam-Webster (m-w.com), you find the technical definition of the noun as 7c, among other related uses within mathematics:
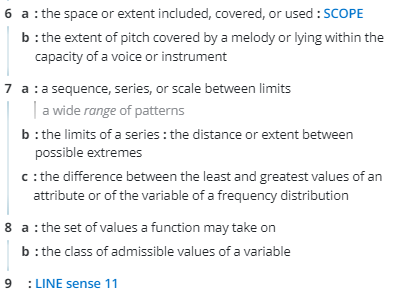
7 a : a sequence, series, or scale between limits
(a wide range of patterns)
b : the limits of a series: the distance or
extent between possible extremes
c : the difference between the least and
greatest values of an attribute or of the
variable of a frequency distribution
8 a : the set of values a function may take on
b : the class of admissible values of a variable
Your use as a verb is
5 : to change or differ within limits
So the verb usage is not specifically mathematical, and is omitted from math dictionaries; the noun usage found in math dictionaries is also found in general dictionaries, but is specialized enough to single out in math dictionaries. (I don’t always trust general dictionaries fully for technical terms, but they can still be a good place to start.)
As you can see from the numbering, there are other meanings as both noun and verb, and these can give a sense of why we use the words as we do in math. Looking currently at the same dictionary, we get a better sense of the range of meanings of a word:
We are told that the word was used originally in English to mean “a row” (noun, 1a1) and “to set in a row” (transitive verb, 1a). Later, it took on meanings like “roam” (intransitive verb, 1a) and “region over which something roams” (noun, 3a). These led to the mathematical usages, where a variable or data can “range” (“roam”) from one end of the “range” to the other.
Definition 8a above is the range of a function, as described in Finding the Range of a Function, at the bottom of which I refer to the same definition, as well as that of “domain”.
In math, technical uses and common uses coexist; we are, after all, speaking English, with special words used only where needed. Here the range as the difference between maximum and minimum is, more specifically, a "statistic", a single number used to indicate one aspect of the behavior of some variable; that needs precise definition, as the other uses do not.
Math dictionaries define this usage because it is not obvious from the everyday meaning.
There is a second aspect to the question: If we think as we do about functions, it makes more sense to talk about the entire interval (from the lowest to the highest number), rather than just the distance between them. That’s what we mean when we talk about “ranging from 72 to 94”.
Why a difference?
Why do we use this single number, when a broader sense (a pair of limits, or a set of numbers) gives more information?

If you think about it, you will recognize that the whole idea of statistics is to boil down large amounts of information to single numbers (mean, standard deviation, and so on). True, the range alone doesn't tell you much; the same can be said of the median. But together, they give a useful picture of how the variable varies. For some purposes, that is just what we want; for others, the set of possible values is of more interest. It all depends on what you want to do with the data.
We discussed these and other statistics, as “a single number to represent the whole”, in Three Kinds of “Average”. The range tells how far the data are spread out; combined with the midrange (the value halfway between the endpoints, which is yet another sort of “average”), we can find the interval containing all the data.
Here are the range (22) and the midrange (83) of our data:
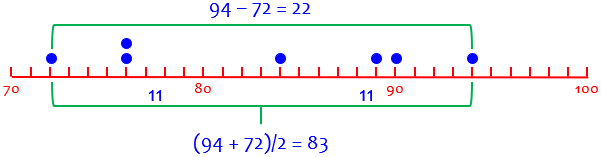
The minimum data value is $$\text{midrange}-\text{range}/2=83-11=72,$$ and the maximum is $$\text{midrange}+\text{range}/2=83+11=94.$$ So the data ranges from 72 to 94.
To add 1 or not to add 1? Two usages in statistics
Another question came earlier in 2003, about a bigger conflict:
Range - Difference or Difference + 1?

I just received a response from the ESP Crayfish science unit to a question I had asked about RANGE. I had asked why they computed RANGE by subtracting the smallest number from the largest number and adding one - since in the math text that we use, they compute RANGE by just subtracting the smallest from the largest number. Is range the same as 'difference' or not? I feel that RANGE should be taught consistently and that one of these two processes must be incorrect. I feel that if range is the same as difference, then the math way is correct, but if range should include the smallest and largest numbers, then the science way is correct. I am a teacher and want to be teaching it to my students correctly.

If I want to find the range of ages of students in my class using the math text, I would subtract 8 from 10 and get a range of two. But the science kit states that we should subtract 8 from 10 and add 1, arriving at a range of 3. Which is correct and why? Thank you!
ESP was the Elementary Science Program for schools, which included a unit (fourth grade) on crayfish, which evidently included some statistics. Evidently, it taught a different meaning for range than the math curriculum!
I answered, pointing out three different definitions:
Hi, Pat.

What was their response? I'm curious!

I'm not a statistician, so I can't answer this from my own experience; but I searched the Web a bit to get a feel for this issue, and found that in fact the range is not defined consistently. It is sometimes defined as the actual interval ("from 3 to 12"), sometimes as the difference between lowest and highest ("12-3 = 9"), and sometimes as one more than that ("12-3+1 = 10").
The first definition (actual interval) is one I mentioned above; the others are two versions of the statistic. The “add one” version was, and still is, hard to find, but I located a couple references, and a name for it:
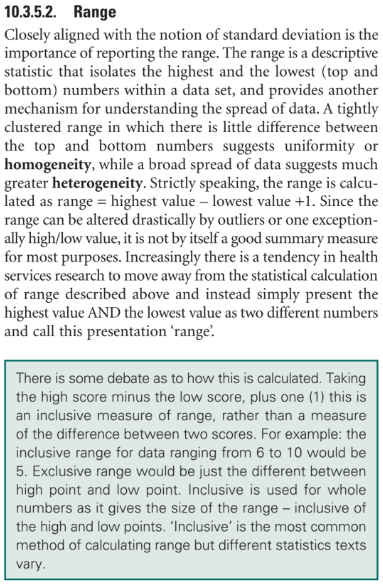
Here is one example:

   Statistical Survival Kit for HRD Practitioners
   http://www.internetraining.com/Statkit/StatKit.htm

"Range is the difference between the highest and lowest scores. You should only use the range to describe interval or ratio level data. To calculate the range, subtract the lowest score from the highest score

"Note: In some statistics books, they will define range as the High Score minus the Low Score, Plus one (1). This is an inclusive measure of range, rather than a measure of the difference between two scores. For example: the inclusive range for data ranging from 6 to 10 would be 5.

"For our purposes, we will define the range as the difference between the highest and lowest scores."
This link is dead, and I can’t find it anywhere else; I’ll show a source with almost the exact same wording, but a different conclusion, later.
Why would the addition of 1 make it “inclusive”? I think of the problem of counting, say, slats in a picket fence, or ticks of a clock, which can easily result in what programmers know as an “off by one error”, or “fencepost error”. Here are five “ticks”, at times 2, 3, 4, 5, and 6 seconds:
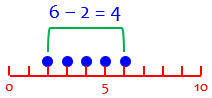
When I subtract the smallest location from the largest, to find the distance between them, I get one less than the actual count; I’ve actually counted the spaces between! This is an exclusive count; I left out one of the end points.
To include all the ticks, I have to add 1:
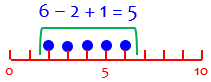
This is an inclusive count.
So the usual range measures distance; adding one counts the actual locations.
I have seen these referred to as "exclusive range" and "inclusive range," as here:

   Descriptive Statistics (Notes)
   http://www.positivepractices.com/ResearchandEvaluation/
DescriptiveStatisticsNote.html

" -- inclusive range: (XH-XL)+1
  -- exclusive range: (XH-XL)  "
I’ve redirected the link to the Internet Archive’s 2003 copy of a now-dead link. Nothing more is said about this. Below I’ll look at some current sources of the same distinction.
Why would this be? It appears that the inclusive definition is used when the data consist of whole numbers; we don't add 1 when the data can be arbitrary real numbers (including fractions). I can see two reasons for this. First, it gives the size of the range, in the sense of the NUMBER of values between the highest and lowest, inclusive. Second, in some cases we can think of each whole number as representing the interval from 1/2 less to 1/2 more (that is, all numbers that round to the given whole number). Doing this extends the range by 1/2 on either end, adding 1 to the range. There are probably some purposes for which this is appropriate mathematically, though I have not taken time to find an example.
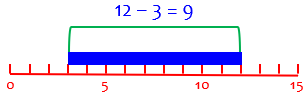
Here is our exclusive range, calculated as the distance from lowest to highest point on the number line:
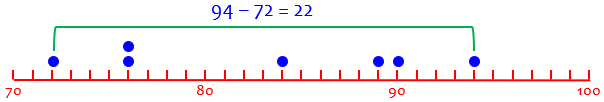
When the data represent specific, precise locations, it makes sense to think of the actual distance between them, which is given by the exclusive range.
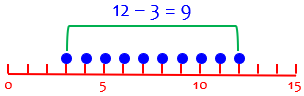
Here is the inclusive range, calculated as the distance covered by all the numbers treated as intervals, which adds 1 to the result:
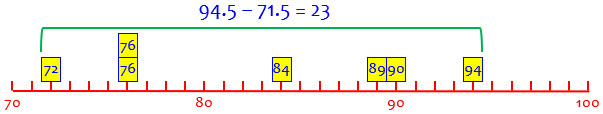
When the data are actually rounded values of measurement, so that the actual values might be anywhere within the little boxes, it makes sense to think about the distance between the lowest and highest actual values of data, which is given by the inclusive range. Here we are counting all the possible values (boxes), not the spaces between their midpoints.
So both definitions are in use, both make sense in their own context, and it really doesn't matter which you use as long as you are consistent, since you will only be comparing ranges measured the same way. It's unfortunate that there are different definitions for the same term (though that is quite common not only in English in general, but even within mathematics); what's really unfortunate is that no one seems to explain this, and you (and the students) are left confused.
It’s quite possible that the crayfish unit involves measuring, say, the length or weight of crayfish, which is a continuous quantity for which adding 1 would be appropriate, whereas the mathematics text is at an introductory, where it is standard to use whole numbers.
But in my experience, even college level introductions to statistics tend to teach only the exclusive form.
Bringing it up to date
A question from Amia a month ago brought all this back to mind:
Hi Dr math ,
How to calculate the range of data set:
Is it the maximum value – the minimum value
Or the maximum value – the minimum value + 1 ?
I answered, referring to the 2003 answer we just looked at:
Hi, Amia.
The answer is, yes! Both are used.
I presume you ask because you have seen both definitions somewhere; I’d be interested to know where you saw them. They probably have different contexts.
Your question immediately reminded me of an old question I answered in 2003, which is in my (long) list of possible future topics:
I then copied the last two paragraphs, and added some examples:
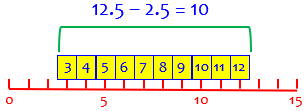
For example, if the values range from 3 to 12 (inclusive), then there are 12 – 3 + 1 = 10 numbers, namely 3, 4, 5, 6, 7, 8, 9, 10, 11, 12; and they might have been obtained by rounding numbers between 2.5 and 12.5 (difference: 12.5 – 2.5 = 10). That illustrates my two reasons for using the inclusive version. To use terms I wasn’t familiar with then, this context involves discrete data, and 3 and 12 are the “limits” (in the context of classes).
On the other hand, if we are talking about continuous data that are real numbers in the interval from 3 to 12, the width of this interval is 12 – 3 = 9. Here, 3 and 12 are called boundaries (if this were a class).
With continuous data, the exclusive range gives the size of the entire region between boundaries (3 and 12):
This seems entirely reasonable as a measure of spread.
With discrete data, the exclusive range still measures the spread, but fails to count the possible distinct values between (but including) the limits (3 and 12):
But if we think of the discrete data as rounded values of continuous data, we can convert the limits to boundaries (2.5 to 12.5), and the inclusive range includes all possible values before rounding:
So my impression now is that exclusive range always makes some sense, but the inclusive range is more what we expect for discrete data.
So, from my current perspective, having tutored students in statistics, I see the difference as related closely to the “continuity correction” we use in treating discrete data (perhaps with a binomial distribution) as if they were continuous data in a normal distribution. I discussed this in
Normal Approximation … or Not?
When we turn dots representing single numbers into bars centered at those numbers, we are adding 1/2 at each end of the range. This also shows up (under the heading “boundary issues” in
In applying the normal distribution to approximate a binomial distribution, we replace, say, “\(x=1\)” in the discrete distribution with “\(0.5\le x<1.5\)” in the continuous distribution.
The second link deals with probability distributions of “grouped data”, where one class (or bin) might consist of the numbers 1, 2, 3, 4, and 5; we say that the width of the bin is 5, not \(5-1=4\), because there are 5 different values; the class limits are 1 and 5, but the class boundaries are 0.5 and 5.5, which we would use in making a histogram. It’s easy to see the connections among all these ideas!
So I expect that you may have seen “max – min” in a context with continuous data, and “max – min + 1” in a context with discrete data. It’s also possible that the latter is used only where this detail matters, while the former is used more commonly just because it is simpler.
Am I right?
Unfortunately, I didn’t get this additional information. And further searching makes my guess less convincing:
Doing current searches equivalent to what I did 20 years ago, I find that Wikipedia gives only the exclusive definition, not changing it for discrete data. So this doesn’t support my expectations!
I am having trouble finding any reference to “inclusive range” now; one of the few sites I found (Reddit) mentioning it refers to only an unnamed textbook, and to my own answer! (Both the sources in my answer are dead links.) I do find the terms used in a few books, such as this, which doesn’t just add 1, but is equivalent.
I did eventually find this (in a textbook that teaches the exclusive definition):
There really are two kinds of ranges. One is the exclusive range, which is the highest score minus the lowest score (or h − l) and the one we just defined. The second kind of range is the inclusive range, which is the highest score minus the lowest score plus 1 (or h − l + 1). You most commonly see the exclusive range in research articles, but the inclusive range is also used on occasion if the researcher prefers it.
So the inclusive definitions appears just to be a rare preference, probably justified by the ideas I expressed.
Possibly the exclusive range has become standard just because it is simpler, and it doesn’t matter much anyway. Many of the sources I found emphasize that the range is not very useful!
While editing this week, I found nearly identical wording (in part) as in the dead link to StatKit above, in a 2018 book, Research Methods in Pharmacy Practice, that teaches the inclusive form:
This author claims that the inclusive range is more common (despite the difficulty I’ve had in finding sources!), and also confirms my suggestion that it would be most appropriate for discrete (whole number) data. Interestingly, he also suggests preferring the interval meaning for range, as in the question we opened with.
Comments from statisticians about actual practice, or other sources, are welcome!
Pingback: Standard Deviation and Its Rivals – The Math Doctors