
Some time ago we looked into the meaning of histograms, on the way to the concept of the Probability Density Function. A recent question focused on the histogram itself, in a way that will add to that discussion. We’ll learn about frequency density, which was overlooked there, and discover an alternative way to label a histogram, called “Adjusted Frequency”, that initially feels awkward, but will become meaningful as we explore it.
Why adjusted frequency? (What is adjusted frequency??)
The question is from Akshita:
I know that, unlike a bar graph, the height of a bar in a histogram represents that respective class interval’s frequency.
But in the first attachment, the height in itself represents its frequency, and in the second one it’s different. There, the height represents frequency density which is nothing but the adjusted frequency. I thought they are one and the same, but I saw that their formulas differ. How come?
What is the need of adjusted frequency to construct histogram with unequal classes? Can’t just the scale alone do??
I also want to know the derivation of formula for adjusted frequency. (I don’t see what’s the need to multiply it with the minimum width.)
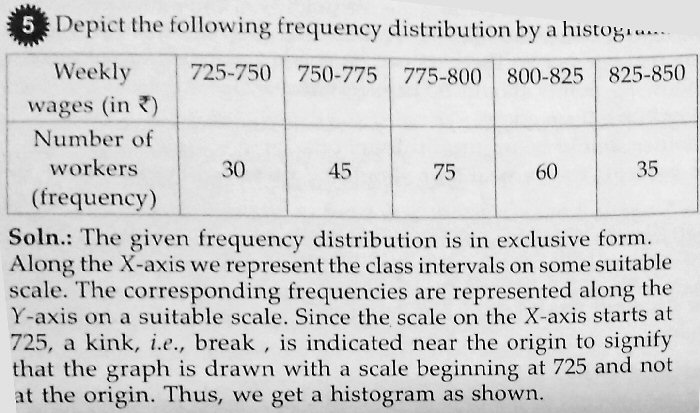
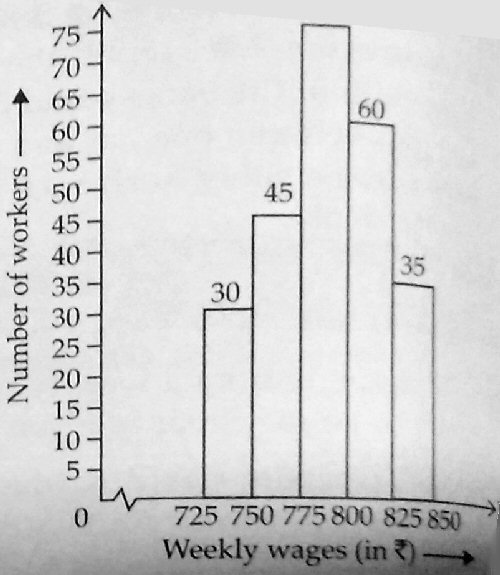
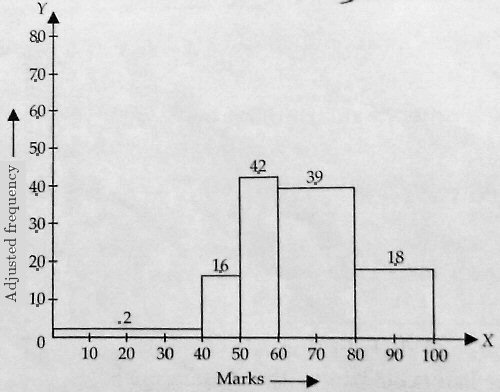
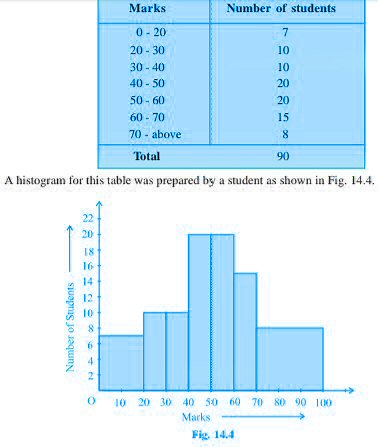
The first example is a histogram with classes (or “bins”) of equal width, and the height of each bar represents the frequency (“Number of workers”). The second has classes with different widths; without seeing the actual problem, we can’t be sure what the actual frequencies are; but the heights should not be actual frequencies, as implied by the label “No. of students”. There are not really 2 students with between 0 and 40 marks.
I wasn’t familiar with the term “adjusted frequency”, so I couldn’t (yet) talk about what its formula is, or why it is or isn’t the same as frequency density. So I asked for more:
Hi, Akshita.
I’m not sure I see the difference you see; both of these are labeled as frequency. This is inappropriate in the second case, where the bins have different widths, but without seeing anything but the graph, I can’t be sure whether it is actually frequencies that are being shown.
You mention “frequency density” and “adjusted frequency”; I am not familiar with the latter term. Can you show whatever definitions and formulas you have been given for these? I can’t explain them without knowing what they are.
But some of your questions may be answered by this post:
From Histograms to Probability Distribution Functions
There I show the development from the basic constant width histogram, with actual frequencies, to the general form, with frequency densities, and beyond.
We’ll be seeing the second problem in full soon.
What adjusted frequency is
But later, when there had been no response yet, I took the time to look it up:
I came back to this question this morning, and searched for the term “adjusted frequency”. (I would have done that before, except that I wanted to see the specific formulas you have learned.) Almost all references I found are associated with India, so I suppose it is largely a regional usage. It is proportional to frequency density; the latter seems more reasonable, as “adjusted frequency” in itself has no clear meaning, so that the labeling of the vertical axis is misleading (as I pointed out that your second example just calls it “number of students”, which it is not).
Here is what Wikipedia says about the topic:
If the bins are of equal size, a bar is drawn over the bin with height proportional to the frequency—the number of cases in each bin. A histogram may also be normalized to display “relative” frequencies showing the proportion of cases that fall into each of several categories, with the sum of the heights equaling 1.
However, bins need not be of equal width; in that case, the erected rectangle is defined to have its area proportional to the frequency of cases in the bin. The vertical axis is then not the frequency but frequency density—the number of cases per unit of the variable on the horizontal axis.
Wikipedia doesn’t use the term “adjusted frequency”; relative frequency is not the same, as it would be a fraction or percentage (probability). Frequency density is yet a different measure. What is “adjusted frequency”, then?
So let’s get back to your specific questions:
“And that, the height represents frequency density which is nothing but the adjusted frequency. I thought they are one and the same but I saw that their formulas differ. How come?”
I imagine that some teacher invented the concept of “adjusted frequency” because they thought that the concept of “frequency density” was too difficult for students at whatever level they were teaching. As you see, they are equivalent (in the sense of being proportional). It is also a larger number than frequency density, which makes it easier to work with.
It appears that the concept is designed in part to avoid fractions, decimals, or percentages.
What an adjustment is needed
In answer to the question “What is the need of adjusted frequency to construct histogram with unequal classes? Can’t just the scale alone do??”:
I’m not sure what distinction you are making here; I would describe “adjusted frequency” as a scaling of each bar to make the areas, rather than heights, proportional to frequency.
Possibly he was using “scale” to mean the height, as shown on the axis.
In answer to the question “I also want to know the derivation of formula for adjusted frequency. (I don’t see what’s the need to multiply it with the minimum width.)”:
The formula for frequency density, as given in Wikipedia, can be written as
frequency density = frequency / bin width
The formula I find for adjusted frequency is
adjusted frequency = (minimum class size / class size) * frequency
(“Class size” is what I call “bin width”.)
This can be rewritten as
adjusted frequency = (frequency / bin width) * minimum bin width
so that it is just frequency density, scaled up. Why? Possibly to make the numbers larger. If the minimum bin width is 1, they will be identical.
Making the formulas more readable, they are: $$\text{Frequency density}=\frac{\text{frequency}}{\text{bin width}}$$ $$\text{Adjusted frequency}=\frac{\text{minimum bin width}}{\text{bin width}}\cdot\text{frequency}\\=\frac{\text{frequency}}{\text{bin width}}\cdot\text{minimum bin width}\\=\text{frequency density}\cdot\text{minimum bin width}$$
And probability density, the focus of my page, amounts to
probability density = probability / bin width
= (frequency / total frequency) / bin width
= (frequency / bin width) / total frequency
which is just a scaled-down version of frequency density, normalized so that the total is 1. This will always be a very small number. I notice that my page bypassed frequency density, because I introduced probabilities (relative frequency) early.
Does this help?
This formula is $$\text{Probability density}=\frac{\text{frequency}}{\text{bin width}}\cdot\frac{1}{\text{total frequency}}=\frac{\text{frequency density}}{\text{total frequency}}$$
The original problem, with frequencies and calculations
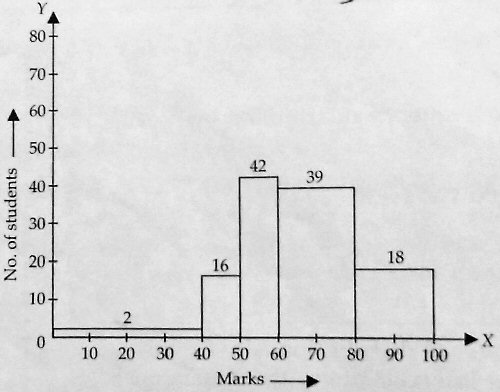
Akshita responded with the complete problem for the adjusted frequency example, showing the calculations for both adjusted frequency and frequency density:
I mean that, if the classes are of unequal size, then area is equal to the actual frequency of that bin. Why so, can’t the height suffice?
In such a case, the height should ideally represent frequency density. But in the following image, the height depicts the adjusted frequency, as you said, possibly to make the numbers larger.
DOES that mean, height doesn’t always represent frequency density and that the length of modified rectangle can be according to adjusted frequency or frequency density.
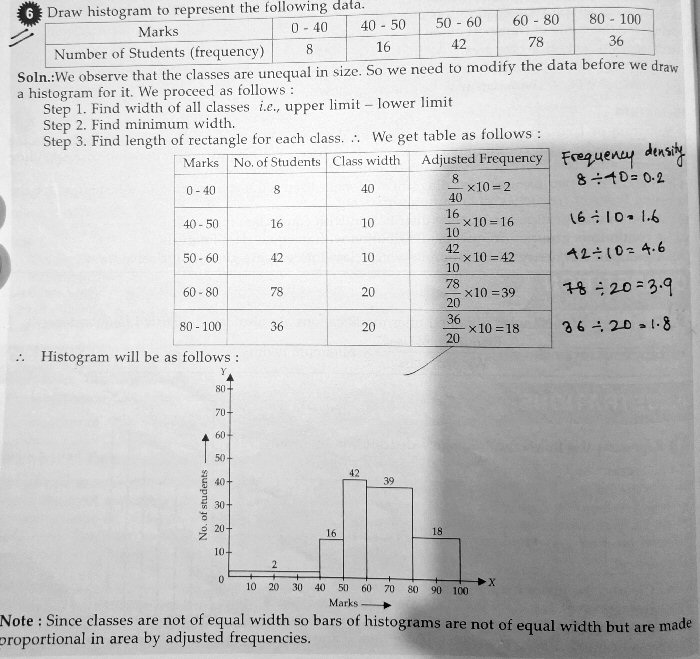
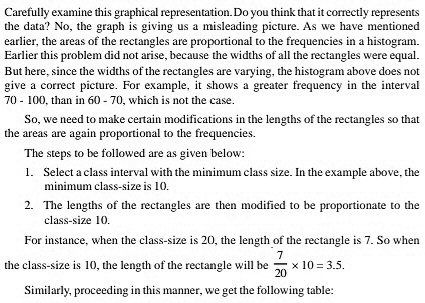
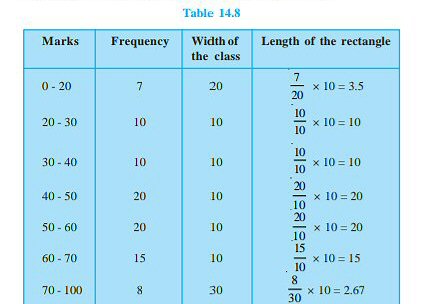
Apart from an arithmetic error for the third class (which should be 4.2, not 4.6), we see that the frequency density is just 1/10 of the adjusted frequency. Using adjusted frequency avoids the decimal (though that would not always be true for real data).
I answered:
Thanks for showing the context of that graph. I do think it’s misleading to label the vertical axis “number of students” when that is not at all what it is! That’s why I dislike this “adjusted frequency” idea, though otherwise it is reasonable; there is no good name to call it, that a reader would recognize.
I also see that you demonstrated, on the side, that the frequency density in this case is simply 1/10 of the “adjusted frequency”, because the minimum class width is 10.
In this case, the book’s histogram could be changed into frequency density by just adding decimal points! This is why both histograms are equally valid:
Akshita’s class is just expected to use adjusted frequency rather than frequency density, which is proportional to it.
Why area matters
What about his question: Why should the area, rather than the height, represent the frequency?
I mean that, if the classes are of unequal size then area is equal to the actual frequency of that bin. Why so, can’t the height suffice?
This is the part of your question that I hoped my old article would answer; but it doesn’t say quite as much as I imagined.
I showed there, under “Introducing probability density”, that with unequal widths, making the height of the bars represent the actual frequency would give a misleading impression. But I didn’t show something that might have made it clearer to you. Let’s do that (and in the process produce your “adjusted frequency”)
Consider this a supplement to the earlier post.
Here is the original graph:
   Freq |
      50|           +-----+-----+
        |           |     |     |
        |           |     |     |
      40|     +-----+     |     |
        |     |     |     |     |
        |     |     |     |     |
      30|     |     |     |     +-----+
        |     |     |     |     |     |
        |     |     |     |     |     |
      20|     |     |     |     |     +-----+
        |     |     |     |     |     |     |
        |     |     |     |     |     |     |
      10+-----+     |     |     |     |     |
        |     |     |     |     |     |     |
        |     |     |     |     |     |     |
       0+-----+-----+-----+-----+-----+-----+
          0-9  10-19 20-29 30-39 40-49 50-59
This has equal-width classes, so actual frequency is appropriate.
If we made our first bin cover the space from 0-19, then if we wanted to reconstruct the original, knowing only that the total in that wider bin was 50, the best we could do (apart from making a guess about how it might be distributed) would be to split the total equally between the two equal-sized half-bins, making each of them 25:
   Freq |
      50|           +-----+-----+
        |           |     |     |
        |           |     |     |
      40|           |     |     |
        |           |     |     |
        |           |     |     |
      30|           |     |     +-----+
        +-----+-----+     |     |     |
        |     |     |     |     |     |
      20|     |     |     |     |     +-----+
        |     |     |     |     |     |     |
        |     |     |     |     |     |     |
      10|     |     |     |     |     |     |
        |     |     |     |     |     |     |
        |     |     |     |     |     |     |
       0+-----+-----+-----+-----+-----+-----+
          0-9  10-19 20-29 30-39 40-49 50-59
There are 50 data items in the first two bins, for an average of 25 in each; if we had only counted the number from 0 to 19, this would be a reasonable guess.
And that is what your adjusted frequency does: it replaces each bar that is wider than the minimum with as many bars as necessary, and divides the count equally among them. Then it joins those bars into one:
AdjFreq |
      50|           +-----+-----+
        |           |     |     |
        |           |     |     |
      40|           |     |     |
        |           |     |     |
        |           |     |     |
      30|           |     |     +-----+
        +-----------+     |     |     |
        |           |     |     |     |
      20|           |     |     |     +-----+
        |           |     |     |     |     |
        |           |     |     |     |     |
      10|           |     |     |     |     |
        |           |     |     |     |     |
        |           |     |     |     |     |
       0+-----------+-----+-----+-----+-----+
             0-19    20-29 30-39 40-49 50-59
The result is that area remains proportional to frequency, as it was in the original, and as one naturally expects (whether one realizes that or not).
That’s what I would have said in the original, if my goal had not been to explain probability density.
A bar 50 units high would exaggerate the number in that first wide class.
So we divide the frequency of a wider bin by the number of “typical bins” to make an average per bin; this is frequency density. Akshita’s teacher is not teaching nonsense:
The height of each bar in any histogram will be proportional to the frequency density, whether you use probability density, frequency density, or adjusted frequency to label them. These are all ways to accomplish the same goal of making area, not height, proportional to frequency.
Does this help?
Defending adjusted frequency
Akshita replied:
I didn’t understand the whole part of probability density though but want to know that while construction, we need to carry out some modifications in the frequency of histogram if the class width is unequal. Which is what frequency density does. Because, if the classes have unequal range, then automatically the class with more breadth will have higher frequency making the comparison absurd.
One more thing, considering the fact that the erected rectangle is defined to have its area proportional to the frequency of classes in the bin, but when it comes to adjusted frequency, if we multiply the class width with the corresponding value of the bin on vertical axis it doesn’t always give original frequency.
In case of frequency density, the area is equal to actual frequency. On the other hand, if the vertical axis represents adjusted frequency, then the area is only proportional to the height of rectangle not equivalent. So we will not be able to get the actual frequency major drawback.
I answered each paragraph. First:
I didn’t understand the whole part of probability density though but want to know that while constructing, we need to carry out some modifications in the frequency of histogram if the class width is unequal. Which is what frequency density does. Because, if the classes have unequal range then automatically the class with more breadth will have higher frequency making the comparison absurd.
I wouldn’t say that a wider class necessarily has a greater frequency, but it is more likely to, and so it would be inappropriate to compare it to others.
Probability density is just frequency density divided by total frequency. It is the probability per unit on the horizontal axis.
Second:
One more thing, considering the fact that the erected rectangle is defined to have its area proportional to the frequency of classes in the bin, but when it comes to adjusted frequency, if we multiply the class width with the corresponding value of the bin on vertical axis it doesn’t always give original frequency.
This is why I have repeatedly used the word “proportional”. This multiplication will not give the actual frequency, but rather that times the width of the narrowest class.
Since
adjusted frequency = (minimum class width / class width) * frequency,
the area of a bar is
class width * adjusted frequency = class width * (minimum class width / class width) * frequency
= minimum class width * frequency
And this is proportional to the frequency.
And to reconstruct the original frequency from the adjusted frequency (now that we know in what way it is “adjusted”!), we can solve $$\text{Adjusted frequency}=\frac{\text{minimum class width}}{\text{class width}}\cdot\text{frequency}$$ to get $$\text{Frequency}=\text{Adjusted frequency}\cdot\frac{\text{class width}}{\text{minimum class width}}$$
This answers the third question:
In case of frequency density, the area is equal to actual frequency. On the other hand, if the vertical axis represents adjusted frequency, then the area is only proportional to the height of rectangle not equivalent. So we will not be able to get the actual frequency major drawback
No, again, you can get the frequency, by multiplying by the ratio of class width to minimal width. That is, we know the constant of proportionality.
I assume you didn’t say what you mean about the area being proportional to the height. That is true only for constant width.
Keep in mind that the actual areas of bars would be measured in square centimeters or the like; we’re talking only about proportionality anyway!
My only real objection to “adjusted frequency” is that the name doesn’t make the meaning clear.
A better presentation, a better name
Akshita now found a different source, which explains the concept of “adjusted frequency” but uses a clearer name:
Pls go through this:
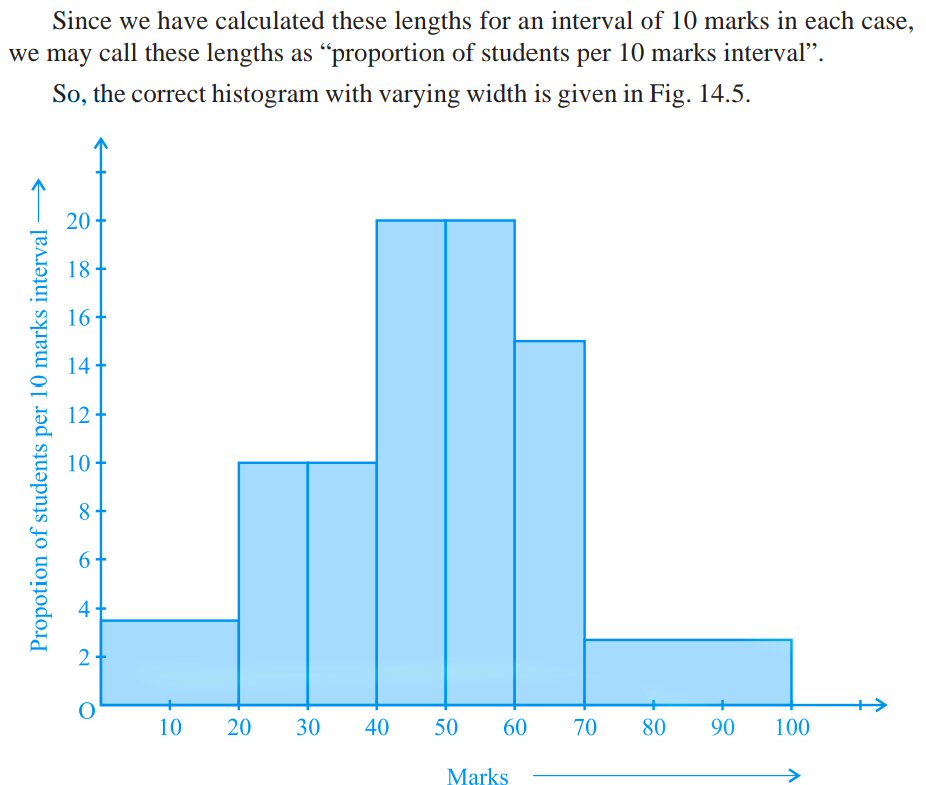
The adjusted frequency here is just the frequency per unit, where the unit is “10 marks” (or “10 points”, as we might say it in America). We are simply choosing a convenient unit of measurement.
I notice that if the class widths were more variable than this, we might use their greatest common divisor as the new unit. For example, if the widths were, say, 20, 10, 15, 25, and 30, we might use 5 instead of the minimum width, 10, so that the heights would be calculated by dividing frequency by, respectively, 4, 2, 3, 5, and 6 (the bin widths expressed as multiples of 5), and labeled as “students per 5 marks interval”.
This way, all of our vertical scales are just adjusted frequencies using different intervals as basic units:
$$\text{Generalized adjusted frequency}=\frac{\text{frequency}}{\text{bin width / basic unit}}$$
$$\text{Frequency density}=\frac{\text{frequency}}{\text{bin width}}\\\left(\text{basic unit = 1}\right)$$
$$\text{Adjusted frequency}=\frac{\text{frequency}}{\text{bin width / minimum bin width}}\\\left(\text{basic unit = minimum}\right)$$
$$\text{Probability density}=\frac{\text{frequency}}{\text{bin width}\times\text{total frequency}}\\\left(\text{basic unit = }\frac{1}{\text{total frequency}}\right)$$
(The last is very awkward in this form, and is included here only to show the they are all proportional. Unlike the others, it is dimensionless, being just a ratio.)
I replied:
That seems to be saying essentially what I have been saying, and is well done.
I like that it gives a meaningful name to the vertical axis, “proportion of students per 10 marks interval“, rather than the unclear “adjusted frequency”. That cancels my one objection. I’m happy with this.
At the start, I was unhappy with the concept of adjusted frequency primarily because of its lack of clarity. In this form, everything makes sense; though many readers may still find it hard to understand, it is easier to follow than the other quantities that are proportional to it; the explanation is excellent. I’ve learned something useful.