
There are three different statistics that are commonly taught as “averages”, or “measures of central tendency”, of a set of numbers: mean, median, and mode. (There are others as well, which we will get to later.) What are they? How do they differ? How do you use them? We’ll look into questions like these as we start a series on averages. To some extent, this will be an expansion of the post Averages, Probability, and Reality.
Defining the terms
Our first question is from 1997:
Mean, Median, Mode, Range

What are definitions for mean, median, mode, and range?
Several of the questions here will mention range; I’m going to omit that from most answers, to narrow our focus.
Doctor Scott answered with straightforward definitions by means of an example:
Hi Jamie!
Let's define each of the words and give an example.
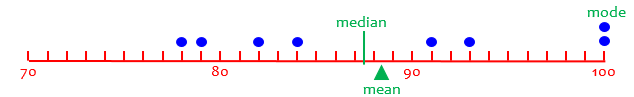
Consider the set of numbers 80, 90, 90, 100, 85, 90. They could be math grades, for example.
The MEAN is the arithmetic average, the average you are probably used to finding for a set of numbers - add up the numbers and divide by how many there are: (80 + 90 + 90 + 100 + 85 + 90) / 6 = 89 1/6.
The MEDIAN is the number in the middle. In order to find the median, you have to put the values in order from lowest to highest, then find the number that is exactly in the middle:
80 85 90 90 90 100
^
Since there is an even number of values, the MEDIAN is between these two, or it is 90. Notice that there is exactly the same number of values ABOVE the median as BELOW it!
The MODE is the value that occurs most often. In this case, since there are 3 90's, the mode is 90. A set of data can have more than one mode.
Observe that the mean is a “center of gravity” takes into account each individual value, so it is pulled strongly toward the extreme:
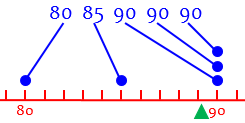
I represent it with a triangle representing a fulcrum on which the data are balanced.
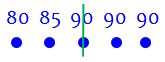
The median ignores the actual values, and just takes into account their order, so that it is “in the middle” in a different sense:
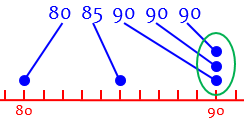
The mode pays attention only to the single most common value (if there is one):
When we use the word “average” by itself, we typically mean the mean. Next week, we’ll look into some details about it; we’ll also see that just as there are different “averages”, there are different “means”!
We have discussed elsewhere some subtleties in the definition of the median. We will eventually have a similar in-depth look at the mode.
We have previously looked at differences between these statistics in Mean, Median, Mode: Which is Best?, which focused on choosing the most appropriate measure for a given situation.
A single number to represent the whole
For more about what each of the “averages” means, and how they differ, we can turn to this question from 1998:
Mean, Median, and Mode

I understand the median, but I am having trouble understanding the mode. Can you please explain?
Doctor Anthony answered, explaining all three:
If you have a set of numbers, say the ages of pupils in a group, then there are 3 different ways of finding a single number to represent the whole group. The most common is the 'mean' or average. For the mean you add up all the ages and divide this total by the number of pupils.

The second way you could find a single representative number is to arrange all the pupils in a line in ascending order of age, with the youngest on the left and oldest on the right. You then go to the person standing in the exact middle of this line and find his/her age. This will be the median age. If there is an even number of pupils you will not have a single person at the midpoint, so you will take the middle pair and give the average of their ages as the median age.

The third way to find a single representative number is to group the pupils by age, so you could have 5 pupils of age 10, 8 pupils of age 11, 14 pupils of age 12, 7 pupils of age 13, 2 pupils of age 14 and 3 pupils of age 15. Looking at this distribution of ages you see that the biggest group is those of age 12, so you say the 'mode' of the distribution is 12. In short, the mode is the most frequently occurring value. If no value occurs more than once then you don't have a mode. Sometimes two values will occur at an equal but greater frequency than other values, and in this case we say that the distribution is bi-modal.
As we’ll see, the main weakness of the mode is that there may not be a mode at all, or there may be more than one.
Working through an example, in detail
Here’s another question from 1998 that asked about one example, and got a little more:
Finding Mean, Median, Mode

I have been out of school for 8 years and I am trying to get my diploma. On one of my practice tests it said to get the mean, median, and mode of scores. However in my textbook there are no examples to show me how to do it. The scores are: 100, 78, 93, 84, 91, 100, 82, 79. I would greatly appreciate if someone would show me how to do them.
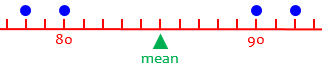
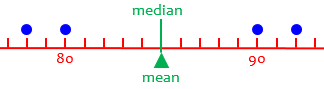
Here are Adam’s data, placed on a number line:
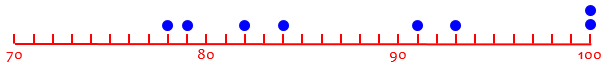
Doctor Sam answered, including helpful comments:
Adam,

The mean of the scores is another name for their average. Just add them up and divide by the number of scores:

     mean = (100+78+93+84+91+100+82+79)/8
          = 88.375

The median of the scores is "the number in the middle" when the scores are sorted in order.  In your example:

     100 100 93 91 84 82 79 78

If there is an even number of scores (as in your example) there is no number in the middle so the two numbers in the middle are averaged:

     median = (91 + 84)/2 = 87.5

The mean of the numbers can be misleading. If I tell you the mean income in my neighborhood is 1 million dollars a year you might think that I am wealthy. But maybe the neighborhood is a poor one with one very rich person making many millions of dollars a year. The average will be large because one number is very large.

The median and the mean together give a better idea of the spread of the numbers. If there were one really wealthy person then the median income would be quite low. In your case the median is quite near to the mean, which suggests that the spread is probably evenly balanced.
The comments here are that the mean is highly affected by “outliers”, values that are far from the others. This is revealed when the median is very different (as in the first example in this post); in the present example, the numbers are distributed fairly evenly.
Here are the three averages on the number line:
The mode of a set of numbers is the number that occurs most often.  In your example:

   mode = 100

The mode may help to correct false impressions if you know the mean and the median but don't actually see the data.

For example, if I tell you the mean of four numbers is 50.5 and the median is 50 you may think that the four numbers are close to one another, like the numbers in your example. In fact, however, I am thinking of:

     101  99   1    1

The mean is (101 + 99 + 1 + 1)/4 = 202/4 = 50.5 and the median = (99+1)/2 = 50. But the mode here is 1. If you know that, you will know that 1 is repeated more than once in the data and, since the mean is near 50 with only four numbers, that might give you the idea that the data include several large numbers and several small numbers rather than four numbers close to one another.
As we’ve seen, the mode doesn’t always even exist, and therefore is not very useful; yet there are times when it can be very revealing. In Adam’s problem, however, the mode really tells us nothing! It just happens that two values are the same, and if one of the 100’s were changed to 99, there would be no mode at all.
Why do we need three “averages”?
The next question, also from 1998, is not about “what”, but about “why”:
Range, Mean, Median, and Mode

I have some questions that you may want to answer for me:

1. Why do we have to study range, mean, median, and mode?
2. Could you help me understand them more?
3. How is it going to help me later in life?
Doctor Stacey took this one:
Hi Stephanie!  Thanks for writing Dr. Math.

Mean, median, and mode are all types of averages, although the mean is the most common type of average and usually refers to the _arithmetic mean_ (There are other kinds of means that are more difficult).

The arithmetic mean is a simple type of average. Suppose you want to know what your numerical average is in your math class. Let's say your grades so far are 80, 90, 92, and 78 on the four quizzes you have had.  To find your quiz average, add up the four grades:

   80 + 90 + 92 + 78 = 340

Then divide that answer by the number of grades that you started with, four: 340 / 4 = 85. So, your quiz average is 85! Whenever you want to find a mean, just add up all the numbers and divide by however many numbers you started with.
Here is the mean; you may notice something special about the data:
The term “arithmetic mean” is used to distinguish “the” mean from other means we’ll be looking at next week.
But sometimes the arithmetic mean doesn't give you all the information you want, and here is where your first and third questions come in.  Suppose you are an adult looking for a job. You interview with a company that has ten employees, and the interviewer tells you that the average salary is $200 per day. Wow, that's a lot of money! But that's not what you would be making. For this particular company, you would make half of that. Each employee makes $100 per day, except for the owner, who makes $1100 per day. What? How do they get $200 for average then?!

Well, let's take a look:

Nine employees make $100, so adding those up is 9 x 100 = 900. Then the owner makes $1100, so the total is $1100 + $900 = $2000. Divide by the total number of employees, ten, and we have $2000/10 = $200. Because the owner makes so much more than everyone else, her salary "pulls" the average up.
The owner’s salary is an “outlier”, which was mentioned before:
Only the mean is affected by the outlier! The single outlier is 9 times as far from the mean as the others. Although the outlier doesn’t pull the mean too far, it does make the mean deviate from what is typical.
A better question to ask is, "What is the _median_ salary?" The median is the number in the middle, when the numbers are listed in order. For example, suppose you wanted to find the median of the numbers 6, 4, 67, 23, 6, 98, 8, 16, 37. First, list them in order: 4, 6, 6, 8, 16, 23, 37, 67, 98. Now, which one is in the middle? Well, there are nine numbers, so the middle one is the fifth, which is 16, so 16 is the median.
We don’t need a number line to show the median:
![]()
By the way, the way I commonly find the middle is to divide the count by 2 and round down. Then I know there will be that many on each side. In this case, \(9\div 2 = 4.5\), which rounds down to 4, so there are 4 below and 4 above the median.
Now, what about when there is an even number of numbers? Look at the quiz grade example again: 90, 80, 92, 78. First list the numbers in order: 78, 80, 90, 92. The two middle ones are 80 and 90. So do we have two medians? No, we find the mean of those two: 80 + 90 = 170, and 170 / 2 = 85. So 85 is the median (and in this case the same as the mean)!
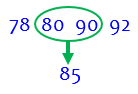
Here we see that the mean and median are the same because the data are symmetrical:
Here when I divide 4 by 2 I get 2 exactly, so I don’t need to round down; and again, there are 2 numbers on each side of the median, which this time is between the two sets of two.
What about outliers?
Now look at those salaries again. To find the median salary, we look at the salaries in order: 100, 100, 100, 100, 100, 100, 100, 100, 100, 1100. This is an even number of x
salaries, so we look at the middle two. They are both 100, so the median is $100. That's much better at telling you how much you'll make if you accept the job.
We saw this above:
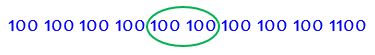
Again, I divide 10 by 2 to get exactly 5, so there are 5 on each side of the middle; the fifth and sixth numbers have to be averaged.
But the median doesn't always give you the best information either. Suppose you interview with a company that has 10 general employees, 7 assistants, 3 managers, and 1 owner. For this company, the mean salary is $400, and the median is also $400. But you are applying for the position of general employee, whose starting salary is $100!  Why are the mean and median so far away?

Well, the 10 general employees each make $100. The 7 assistants each make $400, the 3 managers each make $900, and the owner makes $1900.  If you do the math to find the median or mean, $400 is the answer (try it!). So what can you do?
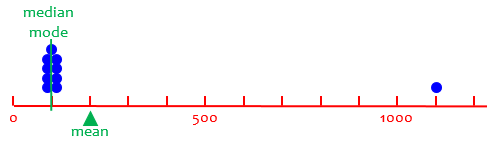
Here are these employees’ incomes on a number line:
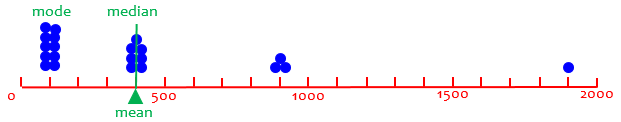
And here is the calculation for the median:
![]()
and for the mean: $$\frac{10\times 100+7\times 400+3\times 900+1900}{21} = \frac{8400}{21} = 400$$
(Here rather than list all the numbers as I did for the median, I used multiplication as a shortcut for that long addition. This leads, as we’ll see later, to the idea of the “weighted mean”.)
The mode is the type of average you want to know in this situation. The mode is the number that occurs most frequently. In the example for median, 6 would be the mode because it occurs twice, while the other numbers each occur once. In our employee example, the mode is $100 because that number occurs ten times, which is more than any other number occurs.
Here is a similar question about the need for different averages, giving a researcher’s perspective on the various statistics:
Using Mean, Mode, and Range
Which is which?
I’ll close with this question, from 2010:
Remember the Mean -- and the Median, and the Mode, and the Range, and the Outlier

I need help with mean, median, mode, range, and outlier. I just can't remember which one's which -- especially the first four (I kinda already know "outlier").

All of them are rather hard. I don't have the first idea of how to do them, so I can't show any work. And since most of them begin with the letter "m," it gets confusing.

My math teacher hasn't give us any memory strategies (or if she has, they weren't memorable).

Also, I have a b-i-i-i-g-g-g AIMS test tomorrow about data analysis. I want to do well, especially since math is my worst subject. I'm sure you get that a lot.

So if you could respond today, that would be awesome. But p-p-l-l-e-e-a-a-s-s-e, by tomorrow.

Thank you, Dr. Math!
I answered this one:
Hi, Riley.

The main way to learn which word has which meaning is just to use them a lot. Do you have some trick to remember which of your friends has which name? Probably not (unless they are twins and you don't know them well as individuals). Once you've spent enough time with someone, you know who they are! The same is true with vocabulary like this.

Having said that, let's see if we can make the meanings more memorable, so you can get to know them as individuals, keeping their meaning in mind as you use them.

An outlier is a number that doesn't fit in with others in its group -- sort of a loner. It "lies outside" of the main group.

The range of a set of numbers is how far they are spread out -- just as the range of a cell phone is how far you can go and still talk, or the range of an animal is how far it travels.
Everyday usages are often not as far from the technical usage as you think, when you look at them right!
The mean of a set of numbers is just another word for the average -- add them up and divide by how many.

The median is the "middle" -- the number in the middle when they are lined up in order. If there are two middle numbers, calculate the median by taking their average (mean).

The mode is the "most common." You may hear the word "mode" as in "a la mode" (originally meaning "fashionable") or "modish" (also meaning "stylish"). These mean that something is, in a sense, popular. The mode is the most "popular" value.

One last tip: of the three terms that start with the letter "m," "median" is the one that sounds most like "middle."
We could also say that “mean” is what we usually mean by “average”; “median” is in the middle alphabetically; and “mode” is … the other one.
Pingback: Making the Mean More Meaningful – The Math Doctors
Pingback: Four Kinds of “Mean” – The Math Doctors
Pingback: Weighted Averages: Finding Your Grade – The Math Doctors
Pingback: One Mode, No Modes, Many Modes – The Math Doctors
Pingback: Stems, Leaves, and Data – The Math Doctors
Pingback: Standard Deviation and Its Rivals – The Math Doctors