
Last week, we started a series on averages, looking at a common list of three kinds of average: the mean, median, and mode. This time, we’ll focus in on the (arithmetic) mean, thinking about why it is appropriate for many applications; that will lead into next week’s discussion of when other kinds of mean are needed. But we’ll start with a nice transition, reviewing where the mean fits into the bigger picture from last time.
Why add and divide?
The question came from a teacher in 2003:
Defending the Mean

I've been asked by one of my students to explain why it makes sense to add the sum of the numbers in a data set and then divide by the quantity of numbers when finding the average or mean.
Doctor Achilles answered by going beyond the question about the mean, and comparing its purpose to the median and the mode:
Hi Leigh,

Thanks for writing to Dr. Math.

That's an excellent (and thoughtful) question.  I believe that when you take time to work through the math that is going on, it is intuitive, but I'm not sure if I can give a more principled argument.  Let me work through what I mean.

Let me explain what I mean by this using students and apples.  Let's say that we have a set of students, and each student has some number of apples.  Some students may have more apples than others.  But I want to know how many apples a typical student might have.

One way to think about this "typical" student is this: If another student walks into the room, how many apples would you guess she has?  Let's take a very simple case: we have 20 students and every single one of them has 8 apples.  If I say another student just arrived, how many apples would you guess she has just based on what you know about the 20 students who are already there?  You'd probably guess she has 8, wouldn't you?  You might not be shocked if I told you she has 7 or 9, but if it turns out she has 17 or 20, you would probably say that there must be something different about her that caused her to bring more apples.
Each kind of “average” reflects a different perspective on this idea of “typical”.
The mode
There are three intuitive ways I can think of to define this "typical" student.  The first is to look and see if a lot of the students have the same number of apples.  For instance, if we have 4 students and 3 of them all have 7 apples and the 4th student has 9 then it might make sense to say that a typical student has 7 apples.  This, as you probably know, is called the "mode".  For a little more information about modes which is not really relevant to this discussion but may be interesting to you or your students, check out this page:

  More Than One Mode?
  http://mathforum.org/library/drmath/view/61375.html
We’ll be looking at that page in a later post. But here are our students:
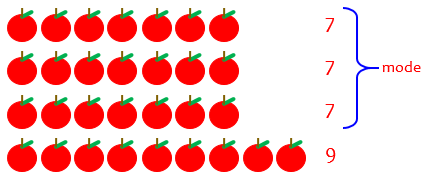
The mode is literally “typical” (that is, what most students are like) – if there is a mode at all. It isn’t good at taking others into account.
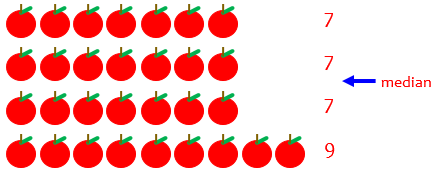
The median
Another way you might define the typical student is to line up all the students in order from the one with the fewest apples to the one with the most, and then say that the one in the middle of the line is the "most typical". I personally find this the least intuitive of the 3 ways to define a typical student, but it is certainly a way you could do it. As you probably know, this is called the "median". This is really, by definition, not so much an assessment of what is typical of the population as a whole as just what is actually true of the one individual in the middle of the population.
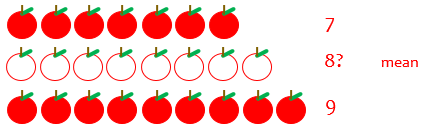
The mean
So what about the mean?  The advantage that the mean has over the median is that it tells you something about the population beyond just what is at the middle.  The advantage that the mean has over the mode is that the mode only works if there is one number which occurs more than any other.  Also, modes only tell you about the largest part of the population but ignore any minority groups.

Let's start with an easy case for why we use the mean.  Let's say that there are 2 students, one with 7 apples and the other with 9. What is a typical student in that group?  Well, it seems intuitive to me (before I really even do any math), that a typical student should be halfway between the two students in our population.  For me, it just plain makes sense to say that a typical student has 8 apples in this set.  No other number represents the set well.  You could say 7 is typical, but that ignores the student with 9 apples.  You could say 9 is typical, but then you have an identical problem.  You could say 10 or even 0 or 20, but none of these numbers are even close to 9 or 7 and you would be downright nuts if you said any of them were typical of this set.  You could maybe try saying 7.5, that doesn't completely ignore the student with 9 apples, but it means you're paying more attention to the student with 7.  Similarly 8.5 doesn't completely ignore the student with 7, but it pays more attention to the student with 9.
Like the median, the mean is literally “in the middle” in this example. (In fact, we would use the same number for the median.)
Someone with 8 apples has just as many more than the 7 as she has less than the 9.
This is easily seen on the number line:
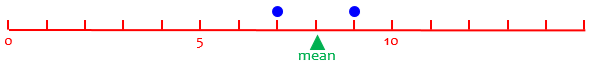
Here, the mean is right where a seesaw with those two dots would balance.
Let's move to a slightly more difficult case. Let's say we have two students with 7 apples each and one student with 10 apples. What is typical in this group? Well, you could say 7 is typical (the mode) but that ignores completely the student with 10 apples. You could say 8.5 is typical (halfway between 7 and 10) but there are two students with 7 apples and only one student with 10 apples, so shouldn't we pay more attention to the 7 apples? What about 8, is that a reasonable compromise? Sure, it is only 1 away from 7 and it is 2 away from 10; it make perfect sense for it to be twice as far from 10 as it is from 7 because there are twice as many students with 7 apples as there are with 10 apples.
Here are our students, with our proposed mean:
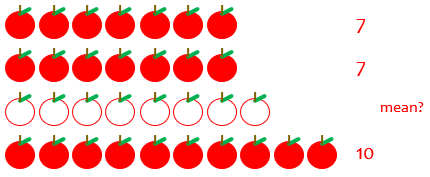
Again, 8 fits in well.
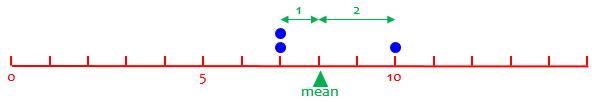
If you know any physics, you can see that this, again, will balance at the mean.
You can make up more examples, but if you work through what seems like a fair way to find a typical student in each group, I bet you'll always come up with the mean.
This has all been pretty subjective. But now we come to what I consider the best explanation:
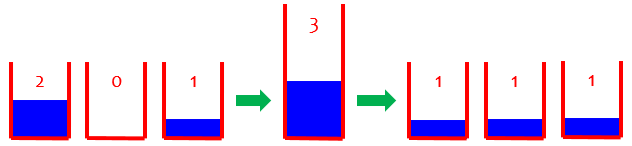
Another way to think of the mean is this: if every student put his or her apples into one big pile (take the sum of all the apples) and then we passed out an equal number of apples to each student (divide by the number of students), how many apples would each student have? Exactly the mean! So the mean is a good way to think about what the group would look like if everyone redistributed their apples so that all the students had the same number.
And this is exactly what we can up with in our example: $$\frac{7+7+10}{3} = \frac{24}{3} = 8$$
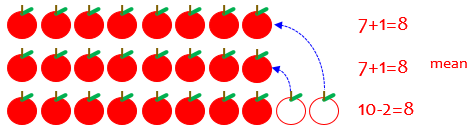
Equivalently, imagine the one with 10 giving an apple to each of the others. Then they are equally distributed, and each one has \(\frac{1}{3}\) of the total. There are 24 apples in all (7 + 7 + 10), and each has \(\frac{1}{3}\) of them:
The rest of this post will largely be different ways to see this same argument.
By the way, were you wondering about the mean of our original set of numbers, 7, 7, 7, and 9? Here it is:
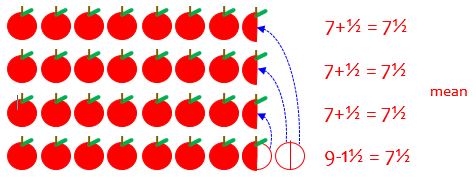
Using the formula, the mean is $$\frac{7+7+7+9}{3} = \frac{30}{4} = 7.5$$
Leigh replied,
Thank you very much for your quick response. That will be helpful tomorrow in my math class and to answer my student's questions. In college, we are taught how to teach to calculate the mean, but not why, so thank you very much.
“Why”, you may have observed, is what Math Doctors live for!
Average rainfall: Smoothing it out
The next question is from 2001:
What Does Average Mean?

Can someone explain what average is? For example what is the average rainfall in New York? I understand the formula needed to find the average, but what is the meaning of average?
I responded, focusing on the idea of rainfall:
Hi, John.

Sometimes "average" just means "normal." Other times it refers to some number "in the middle"; there are several different ways to define an average. But the usual average, which you are familiar with, called the "arithmetic mean," is calculated by summing all the values of something and then dividing by the number of values you used.

What this really means is that you are finding a single number that you could use in place of all the different numbers and still get the same total. For example, suppose that the rainfall one day is 2 inches, the next day 0 inches, and the next day 1 inch. The total rainfall over the three days is 3 inches, so it is just as if there had been 1 inch each day. So the average daily rainfall over that period is 1 inch.
Do you see that an average "smooths out" the numbers? It's as if there were two inches of dirt on one block of sidewalk, none on the next, and one on the third. If I spread all the dirt out evenly, so it was all the same level, there would be one inch over the whole sidewalk.
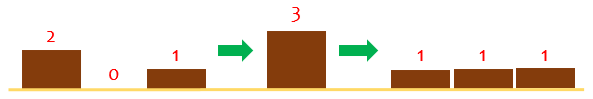
(I switched to dirt because water doesn’t pile so well.)
In the same way, if we spread the rain out evenly over all three days, there would be one inch every day. Of course, everything isn't "just as if it rained an inch every day"; then you could never have a picnic in Central Park! But just from the perspective of the total amount of rain, it's the same. And that's why there are different kinds of average: if something else is important other than the total, then you can get a different "average."
We’ll be seeing more kinds of mean next time, which apply when something other than the sum is meaningful.
The picnic idea is a reminder that any kind of average reduces lots of data to a single number, and loses any information about how the data are distributed. How it piles (the distribution) can be just as important (or more so) as how much there is overall.
It's also important to ask what data are represented by the average you are talking about. Is the "average rainfall in New York" the average per day over some particular number of days? Is it the average over a whole year? Is it the average per year over a number of years? Or the average amount on December 5 over several years? The actual amount will vary with the season as well as from year to year, and you can average the data to eliminate either variation, or both, depending on what your goal is.
Average? Of what? Over what time period? These are important questions to ask.
Average pile: Visualizing the mean
Continuing the same idea, here is a question from a teacher in 2003 asking for a way to use manipulatives:
Teaching the Concept of Average

How can I use objects to teach averages to students?
I answered, first referring to that last answer, and then turning it into a demonstration:
Hi, Ridya.

For a discussion of what averages are, see our archives:

   What Does Average Mean?
   http://mathforum.org/library/drmath/view/52809.html

As I explain there, the essential idea of averaging is "smoothing numbers out." You might introduce the idea by giving each student a different number of, say, blocks or balls or cards, and asking how many each of them has. Write those numbers down, and point out how they vary. Then have them work together to find a way to share them equally. (You may or may not have chosen the total number of objects such that they CAN be shared exactly.) Eventually they should all have about the same number of objects, and you can discuss with them how they could have decided ahead of time how many each of them should have. The answer, of course, is to find the total number of objects and divide by the number of students. The resulting number - the number that each has if they share equally - is called the average.
There are several strategies the students might invent. One, as I’ve suggested, is to pile the blocks together and then hand them out one by one; another is to have the student with the most give some to the one with least, and repeat until they are nearly equal. The first of these is a better way to understand the calculation, and is also often more efficient. But sometimes just moving a few blocks around may be quicker! That is shown next:
You can also do this as a smaller-scale demonstration. Make piles of blocks of different heights, like

         H
    H    H
    H    H              H
    H    H    H         H
    H    H    H    H    H
    H    H    H    H    H
  -------------------------

Then move blocks from the higher piles to the lower ones to make all the piles equal:

    H    H    H    H    H
    H    H    H    H    H
    H    H    H    H    H
    H    H    H    H    H
  -------------------------

You have just found the average: on the average, each pile had 4 blocks in it. And how can you find that number if you just have the numbers 5, 6, 3, 2, and 4 from the original piles? You add and then divide.

So, yes, division is central to finding an average. But addition is the other half of the work. Does this help clarify the relationship?
Even though we didn’t make a single pile, the result again suggests the calculation: The end result is 5 piles of 4, so the total count is \(5\times 4 = 20\); and we can see that if we knew the total, we could find the average by dividing \(20\div 5 = 4\).
(Incidentally, if you are wondering why I commented on the role of division, that’s because in editing for the archive, the question was shortened. In the original, Ridya expressed confusion about the difference between average and division.)
Ridya replied,
Good Day, Dr.Math!
Thanks for your explanation as it really helps me out to solve my problems regarding average. I will use your ideas to introduce this topic to my students. Thanks again.
Ridya
Average speed: The same net effect
Our last question is from 2008:
Average Speed and How It Relates to Average in General

The average speed of an object is distance/time.  We are taught that the average is found by adding up the number of items and dividing by how many there are.  How does this average relate to the average speed or are they unrelated?
On the surface, these seem like very different things: a ratio of distance to time, vs. adding numbers and dividing. Why are they both called “average”? It turns out that they are the “continuous” and “discrete” versions of the same concept.
I answered this:
Hi, Brian.

Yes, these ideas are very closely related.

The essential idea of "average" in both senses is "a uniform value that could be put in place of all values in a collection, without changing the net effect".

In the case of averaging numbers (specifically what is called the arithmetic mean), this means that you want to find what number they could all be replaced by, and still have the same sum.  As an example, if 10 people all had different amounts of money and wanted to share it equally, they would put it all together (adding the amounts) and then each take an equal share (dividing by the number of people).  Then they all have the same amount, but the total is the same as it was originally.
This is the same idea we’ve been looking at: $$\frac{\text{Total value}}{\text{Total count}}$$
In the case of average speed, suppose you have been driving at varying speeds during different parts of a trip, but you want to know at what speed you could have driven to take the same amount of time, if you had driven at a constant speed. To find out, you take the total distance driven, and divide by the total time it took. If you had driven at that speed throughout the trip, you would have arrived at the same time. In a sense, we have divided the distance equally among all minutes of the trip.
This time, it’s $$\frac{\text{Total distance}}{\text{Total time}}$$
Note that in both cases you are dividing a total by a total--the total amount of money by the total number of people, and the total distance by the total time. In fact, if you drive distinct segments of your trip at different constant speeds, it turns out that the average speed is the weighted average of the individual speeds: you multiply each speed by the time for which you drove that speed (which is called a weight) and then divide by the sum of the weights (the total time).
Weighted average is another concept we’ll be looking at later in this series. But next week, we’ll look at different means: arithmetic mean, geometric mean, harmonic mean, …
Pingback: Four Kinds of “Mean” – The Math Doctors