
(A new question of the week)
I mentioned that we have had a number of questions related to Venn diagrams recently. Here I would like to show a couple of these, from a Philippine student. Even fluent English speakers can get confused in these problems; observing how a student new to the language misinterprets details can also help us see how anyone new to Venn problems might think.
How many questions?
Here is the first question:
Q: One hundred new books are released nationally over a busy 3-day stretch in December. Eight had an e-book version available only on Amazon, 5 were available only on Google books, and 18 were only available on iTunes. There were 26 total available on Google, 7 that could be found on both Amazon and Google but not iTunes, and 4 could be found on both iTunes and Google but not in Amazon. Draw a Venn diagram representing this information and use it to answer the following questions.
a. How many books were available on all three services?
b. Explain why you can’t find the number of books that were not available on any of the three services.
c. If every book released was available as an e-book on at least one of Amazon, Google, or iTunes, how many were available on Amazon and iTunes but not on Google?
d. In that case, how many were available on exactly two of those three services?
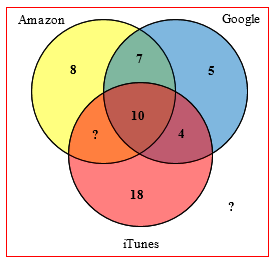
A: This A means attempt or approach, not Answer. First, I create a Venn diagram.
I divide the diagram into regions
I – {Amazon only}
II – {Google and Amazon, no iTunes}
III – {Google only}
IV – {Amazon and iTunes, no Google}
V – {all of the three}
VI – {Google and iTunes, no Amazon}
VII – {iTunes only}
VIII – {none of the three}So the number of elements in each region are
I = 8, II = 7, III= 5, IV = ?, V=10, VI=4, VII=18, VIII=?a. My answer is, the region V, 10.
b. Insufficient information about the total books on Amazon or in iTunes and books that are exclusively available on both.
c. This part is where I got confused. But I conveyed it as that I need to create three separate diagrams on each so,
If every book released was available as an eBook in Amazon
I = 56, II = 12, III=0, IV=18, V=14, VI=0 VII=0, VIII=0If every book released was available as an eBook in iTunes
I,II,III,VIII= 0, IV=8, V=17, VI=9, VII=66If every book released was available as an eBook in google
I,IV,VII,VIII=0, II= 15, III=63-?, V=10+?, VI=22So my answers are 18 (Amazon), 8 (iTunes), and 0 (Google)
d. From my answers on question c, there are [18 (Amazon), 17 (iTunes), 37 (Google)] available on exactly two of those three services.
Additional concern: If my answer was correct in question b, I would like to know if there are other ways to express clearly my answer.
Furthermore, how should I answer or approach question c. I mean, what was the intended or expected type of answer? If there are more than one solution, I would also like to know the others.
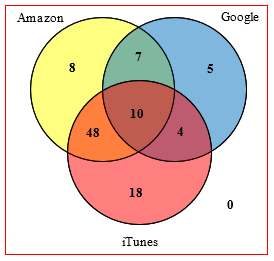
His (correct) Venn diagram would look like this:
He has made a version of a rather common error of interpretation for relative beginners in set theory or probability, who sometimes take question like “what is the probability of this and that”, or “of this or that”, as asking two separate questions. I responded:
I think you have misinterpreted the question:
c. If every book released was available as an e-book on at least one of Amazon, Google, or iTunes, how many were available on Amazon and iTunes but not on Google?
Evidently, you are taking the question as three separate questions, in which you would assume the total is known for one of the three. But that requires changing some of the numbers you are given! And that is not what it says. It is one question.
What it means is that you are to suppose that region VIII is empty — every book is released in at least one of the three sources, so there are none that are in none of them. So set your “?” in VIII to 0, and calculate the rest from that.
As for (b), I don’t know what would be the best way to say it. I would say, as you did, that there is not enough information, and that if we knew the total for either Amazon or iTunes, we could find the answer.
One way to express it is that you are given 7 facts (which could be written as 7 equations), but there are 8 unknowns (regions in the Venn diagram), so the problem is underdetermined. One more piece of information makes it fully solvable, because you will have 8 equations in 8 unknowns.
Now he successfully worked out part (c), using the fact that there are 100 books in all:
What is the answer to part (d)?
What are the sets?
Then he asked another similar question, which raised a different issue of interpretation:
In a study of 400 entrees served at 75 campus cafeterias, 70 had less than 10 grams of fat but not less than 350 calories; 48 had less than 350 calories but not less than 10 grams of fat; 140 had over 350 calories and over 10 grams of fat.
I had two solutions for this question. Because our topic for this week is Venn diagram, it makes me confused to answer this problem by Venn diagram approach.
(1) I think this data can’t be arranged in a Venn diagram “manner”, because a person who has less than 10 grams of fat and over 350 calories can’t be on the group of persons with over 350 calories and over 10 g of fat. Which makes me think that this should be listed.
(2) 10 g of fat 350 calories n
less than greater than 70
greater than less than 48
greater than greater than 140
Less than less than 142Questions are:
A. What percentage of entrees had less than 10 g of fat?
70+142=212/400=53%B. What percentage of entrees had less than 350 calories?
48+142=190/400=47.5%
Is my (mis)interpretation correct?
We will have to figure out why he thinks he can’t make a Venn diagram; this will take us into some easily-overlooked basic concepts.
Doctor Rick answered:
I get the answers you get.
I don’t know why you say, “I think this data can’t be arranged in a Venn diagram ‘manner’, because a person who has less than 10 grams of fat and over 350 calories can’t be on the group of persons with over 350 calories and over 10 g of fat.” Certainly we can draw a Venn diagram, with two overlapping circles, representing (as one possibility) entrees with no less than 10 g fat, and entrees with no less than 350 calories:
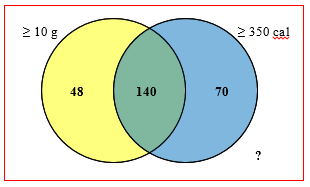
You aren’t told how many entrees fall outside both sets, so I put a question mark there. Knowing the total number of entrees in the diagram, you can calculate that number to be 400 – (48 + 140 + 70) = 142, as you did.
The Venn diagram can be helpful to get an overall picture of what’s going on, but for the calculations when there are only two sets in the diagram, I personally prefer putting the information into a table:
             |  < 350 cal | >= 350 cal | TOTAL
-------------+------------+------------+------
  < 10 g fat |            |     70     |
-------------+------------+------------+------
 >= 10 g fat |     48     |    140     |
-------------+------------+------------+------
       TOTAL |            |            | 400
The empty cells can be filled in one at a time, then the table can be used to answer the questions.
After a little back and forth, it was recognized that he had made two mistakes. One, which didn’t really affect his work but did make it hard to communicate, was a “false friend” error in English: he assumed that entree meant a person who entered the restaurant, rather than a food. The other error was in the identification of the sets in the problem. To root this out, Doctor Rick more precisely described his:
Now, what are your set A and set B? The sets in my Venn diagram could be labeled:
Set A = entrees with no less than 10 grams of fat (circle on the left)
Set B = entrees with no less than 350 calories (circle on the right)Then it’s true that an entree with over 10 g of fat and over 350 calories is in both sets A and B — that is, it’s in the intersection of A and B, written A ∩ B. There are 140 entrees in this set A ∩ B.
The student replied,
Let me set a specific example. Say, a burger. A certain burger has over 10 g of fat and over 350 cal. This burger satisfies the condition of my A ∩ B.
A = burgers with less than 10 g of fat but over 350 cal
B = burger with over 10 g of fat but less than 350 cal.
So, my point is, the burger with over 10 g of fat and over 350 cal is also the burger of the set A and B, which is for me is impossible. It’s not okay, because that burger with over 10 g of fat and 350 cal CANNOT be in the set, or group, of burgers with less than 10 g of fat and over 350 cal NOR in the group of burgers with over 10 g of fat and 350 cal. In fact, I’m really perplexed.
Finally we can get somewhere, because each party has defined his terms!
You seem to be defining the sets A and B in a different way, such that each distinct region in the Venn diagram is considered to be a set in itself. That’s not how we normally work with Venn diagrams. You have given names to two of the four regions in the diagram:
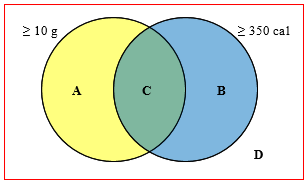
The set that I called A (all entrees with at least 10 grams of fat) consists of both regions A and C above; and the set that I called B (all entrees with at least 350 calories) consists of both C and B above. My “A intersect B” is the region marked C above, which is in both A and B. Your “A intersection B” is an empty set, because your A and B are disjoint sets — they do not overlap. You’re correct that “the burger of the set A and B … is impossible.” If the sets are defined as you are doing, every entree must be in at most one of the sets.
Perhaps you have misunderstood the whole idea of a Venn diagram and its relation to sets.
The student answered,
You said your intersection is composed of 140 entrees that is OVER 350 cal and OVER 10grams of fat, right? If we “separate” your Venn diagram into just two circles without intertwining them, then your set A will be 140+48=188 and your set B has a cardinality of 140+70=210. I know you are thinking some arguments right now to swoop me off my ideas, but make it rest for a while and hear me another minute. So your set A is now composed of entrees that are MIXED. What I mean by mixed is that your set A is composed of 48 entrees that has OVER 350 cal BUT LESS THAN 10 grams of fat and 140 entrees that is OVER 350 cal and OVER 10 g of fat, and my point is you labeled your set A as entrees with no less than 10 g of fat BUT WITH LESS THAN 350 cal. Clearly, the 140 entrees doesn’t fit to your set A’s requirement because they had OVER 350 cal. Same for set B too. I really hope you understand my point and do some analyzation about my argument.
At this point, I thought a new perspective might help, so I stepped in:
Clearly you are having some trouble with the language; I think it may help if we go back to the first thing Doctor Rick said:
Certainly we can draw a Venn diagram, with two overlapping circles, representing (as one possibility) entrees with no less than 10 g fat, and entrees with no less than 350 calories:
Now, a key idea in Venn diagrams is that each set relates to only one “attribute”.
The first set, which I will call X to avoid confusion with your use of A and B, is the set of all food items (“entrees”) that have at least 10 grams of fat. This set contains 48+140 = 188 elements – both items with at least 10 grams of fat and less than 350 calories, and items with at least 10 grams of fat and at least 350 calories. All items that have less than 10 grams of fat are outside this set. But items may be in this set regardless of their calorie count. This set ignores that, and considers only fat content.
The second set, Y, consists of all items that have at least 350 calories, regardless of their fat.It is possible that your difficulty is with his words, “entrees with no less than 10 g fat, and entrees with no less than 350 calories”. Note the repetition of the word “entrees”. He was not saying that one set, A, consists of items that have >=10 g AND >= 350 cal. He was describing two sets: my X, consisting of all items with >= 10 g fat, and my Y, consisting of all items with >= 350 cal.
You wrote, “So your set A is now composed of entrees that are MIXED. What I mean by mixed is that your set A is composed of 48 entrees that has OVER 350 cal BUT LESS THAN 10grams of fat and 140 entrees that is OVER 350 cal and OVER 10 g of fat, and my point is you labeled your set A as entrees with no less than 10 g of fat BUT WITH LESS THAN 350 cal.” This is what I just said he did not mean. He didn’t label a set A; he labeled it “>= 10 g”. This is what I called X, and is the entire left-hand “circle”.
I would actually say that this set X, while “mixed” in one sense (with respect to calories), is actually focused on only one attribute, namely fat, and in that sense is not “mixed”.This, again, is a key idea in Venn diagrams. The set X overlaps set Y, and includes both of those regions (in Y and outside of Y).
Now he replied showing understanding:
I had to read the question and Dr. Rick’s explanation 999 times and sleep 13 hours to understand it but I get it now! Yes! I think my problem was solving sets with two attributes. I think when Doctor Peterson said “regardless” it corrected my thinking. Because my problem was I set the set A with 2 SPECIFIC attributes instead of having just one. I’m very thankful! (For your patience)
As I suggested earlier, even students who know English well may be tripped up by misunderstandings like this.
What is included?
Let’s look at one more issue, though I dealt with it in part already:
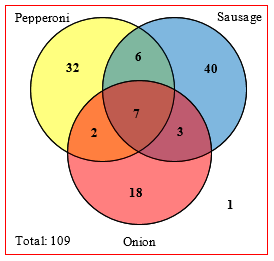
“According to a survey conducted by the National Pizza Foundation, out of 109 customers surveyed, 32 prefer pizzas with just pepperoni, 40 with just sausage, and 18 with only onion. Thirteen bigtime carnivores like pepperoni and sausage, 10 customers prefer sausage and onions, 9 customers like pepperoni and onions; in each case, the third item could be included as well. Seven go all out, ordering all three.”
I created a Venn diagram
Regions
I = only pepperoni = 32
II = pepperoni and sausage w/o onions = 6
III = only sausage = 40
IV = pepperoni and onion w/o sausage = 2
V = all three = 7
VI = onion and sausage w/o pepperoni = 3
VII = only onion = 18
VIII = none = 1a. How many customers prefer pepperoni, or sausage, or pepperoni and sausage with no onion? 78
b. What about sausage, or onions, or sausage and onions with no pepperoni? 61
c. How many go the boring route- none of those toppings? 1
I’m certain for my answer except for this part of the question: “in each case, the third item could be included as well.”
I tried Google Translate but it didn’t help much. So my thoughts are, there will be no element in exactly two of the toppings, instead they will be added to all of the toppings region, V, and the no. of elements in Region IV is 18?
Here is his Venn diagram, which he obtained by subtraction as we did Monday:
He did well, even with the challenge of “sausage, or onions, or sausage and onions with no pepperoni”, which has to be understood as “only sausage, or only onions, or sausage and onions with no pepperoni”. What about his question about “the third item”? I replied,
I think the question is poorly written, because saying that one prefers pepperoni and onion, for example, in real life would refer to that particular combination, not just that they like both pepperoni and onion (and may also like something else with it), as the whole Venn diagram implies. (Someone might like both pepperoni and onion, but not like them together, or not like them with sausage even though he likes sausage alone.) That is, a question about what particular pizzas people like is really a different problem than one about sets and intersections and unions. But we know this is supposed to be about sets and Venn diagrams, so we have to interpret it that way. If it were a real-life problem, we would not do so!
I interpreted the problem as you did, and agree with the answers you wrote; I did so because of that clause, “in each case, the third item could be included as well”. That tells us that they are not just referring to the particular combination (pepperoni and onion) but to any combination that includes it.
I would prefer if the problem had been written more like this:
“According to a survey conducted by the National Pizza Foundation, out of 109 customers surveyed, 32 like only pepperoni, 40 only sausage, and 18 only onion. Thirteen bigtime carnivores like both pepperoni and sausage, 10 customers like both sausage and onions, 9 customers like both pepperoni and onions. Seven are willing to eat all three.”
This sort of thing happens occasionally when someone wants to add interest to a problem, but doesn’t stop to think about whether the problem he is writing is the problem he had in mind before he added all the words!
I often find that problems are written under unnatural assumptions (due to the author’s having started with the math rather than with the actual problem), and not as a reader would naturally interpret them. If a real-world boss or client came to us with a problem, we would expect them to be speaking their own natural language, and interpret accordingly; here, we have to interpret the question in light of its authorship by a math teacher!
There were these two confusing statements.
1. 5 were available only on Google books
2. There were 26 total available on Google.
My confusion is Google books and Google are different?
If so then there should have been 4 Circles instead of 3.
Or am I making some mistake?
Oh! does the Google represent Universal set?
Regards,
Rahul.
Hi, Rahul.
This is a different kind of “language issue” than the main topic of the post, but it is an important one: Questions like this are stated in ordinary language (though, I as mentioned at the end, that language is often flavored with a little mathematical style), and that means ambiguity!
Often we need to consider different options for interpreting something, and eliminate those that don’t make sense. Since “Google books” is mentioned in full only once, if that were to be distinguished from mere “Google”, we couldn’t solve the problem! As you say, we would need another circle, and we wouldn’t have enough information about it.
So we conclude that “Google” is being used as a short name for “Google books”, and we find that the problem makes sense when taken that way. We can also bring in our cultural knowledge, and realize that “Google” would otherwise mean a search engine, not a platform for releasing e-books; and that doesn’t make sense.
This sort of thing is very common. I often tell students that the hardest part of a word problem is the words! Or, the hardest part of math is sometimes English.