
Puzzles involving two or three properties of people or objects, commonly solved by Venn diagrams, are popular with teachers, and perhaps not so popular with students! Several have asked about them recently, leading me to catalog our past answers about them, to find the most useful examples to point to. Some of these are very easy, some much harder, and solved by different techniques. Let’s look at a few of them, including some where the meaning is easy to get wrong.
The basics: two sets
We’ll start with a simple problem involving two sets, from 1996:
How Many are in the Group?

Mr. Jackson polled the class to see how many students had been to one or both of the nearby state parks. He found that everyone in Katie's group had been to at least one of the parks.  When he asked how many had been to Punta de las Cuevas, four children raised their hands. When he asked how many had been to Salt Bay, three raised their hands.  When he asked how many had been to both state parks, two raised their hands.

How many people were in Katie's group?
This is a very straightforward example, and two of us answered it. First, Doctor Dennis:
Questions like this are often very easy using Venn Diagrams.

Imagine you have a big rectangle. In that big rectangle are two circles which are partially overlapping. Now, say that all the students at the table are represented by the stuff within the rectangle. Call one circle people who have gone to Punta de las Cuevas and the other circle people who have gone to Salt Bay.
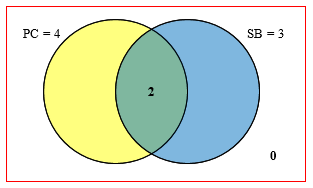
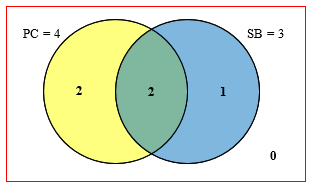
Now, since two have been to both parks there are two students in the area that is the intersection of the circles. The Salt Bay circle should have 3 people in it, but there are already two people in the part of the circle that intersects with the other circle, so there is just one person in the part of the Salt Bay circle that is not within the other circle. Similarly, there will be 2 people in the Punta de las Cuevas circle that are not in the part that overlaps the Salt Bay circle. so there are 2 + 2 + 1 = 5 kids total.
This is typical of many more complicated problems, in that the key idea is subtraction. We know the whole of a set, and one part, so we subtract to find the other part.
Skipping the Venn diagram: reasoning
Simultaneously, Doctor Keith answered, without using a Venn diagram, showing that this is just a tool for organizing information, not an essential part of the work:
This is an example of everyone's favorite type of problem, the word problem. The real trick to word problems is trying to turn the words into equations. Let's summarize what we have in a table for easy reference:

                        Number of students
Place                   who have been there

Punta de las Cuevas            4
Salt Bay                       3
Both                           2
Neither                        0

We have several ways of looking at this but probably the easiest is a logical argument.  The two students who have been to both parks would have raised their hands for both Punta de las Cuevas and Salt Bay.  Thus two of the students in the Punta de las Cuevas group are also in the Salt Bay group.  So let's find out how many have been to only one.

For Punta de las Cuevas, four students have been but two also went to Salt Bay, so we have to remove them (remember we want students who have only been to Punta de las Cuevas).

  4 - 2 = 2  no. of students who have only been to Punta de las Cuevas

Thus only two students have only been to Punta de las Cuevas.  Similarly, for Salt Bay we have three students who have gone, but two also went to Punta de las Cuevas so we must remove those two from the three who have been.

  3 - 2 = 1  no. of students who have only been to Salt Bay

Thus only one student has gone to only Salt Bay.  To get the final answer we note that the sum of the students who have only been to Punta de las Cuevas, plus those who have only been to Salt Bay, plus those who have been to both must be the total in the group.  So:

  2 + 1 + 2 = 5

Thus there are 5 students in the group.
You may notice that the work here is identical; it just took more words, in the absence of pictures!
He went on to repeat the work by giving names to the students, showing the benefit of using math and ignoring such details! Math can often be best learned by starting with more concrete images (an actual group of individual children), and gradually reducing that to mere numbers as one understands relationships better.
Skipping the Venn diagram: table
Let’s look at one more example with two sets, this one using a table rather than a Venn diagram. This is from 2009:
Alternate Solution Path to Venn Diagram Problem

There are 30 students in a math class.  Twelve belong to the computer club, and eight belong to the photography club.  Three belong to both clubs.  How many belong to neither club?

I know that the correct answer (according to the book) is 13.  I can't come up with that answer.  I have either 10 or 7 as my answers, not knowing if the "both club" members are included already in the listed number of members.

This question is listed in a section introducing proportions.  I can't figure out a way to come up with the correct answer or use a proportion to solve it.  Sometimes when I know the correct answer I can work backwards to solve it, but I can't do that with this problem.  It is driving me CRAZY!
Doctor Ian responded:
This sort of problem is often solved using a Venn diagram.  You can read about them at these locations:

  Wolfram Mathworld: Venn Diagram
  http://mathworld.wolfram.com/VennDiagram.html

  Venn Diagram: Fast Food Restaurants
  http://mathforum.org/library/drmath/view/60772.html

But here's another way to organize the data you have and solve the problem.  Suppose we make a table like this:

              photography ~photography
            +------------+------------+
   computer |            |            |
            +------------+------------+
  ~computer |            |            |
            +------------+------------+

(I'm using "~" as an abbreviation for "not".)

Can we agree that everyone in the class must be in EXACTLY one of these boxes?

We're told that there are 30 students.  So the numbers in the boxes have to add up to 30.

We're told that 3 students belong to both clubs:

              photography ~photography
            +------------+------------+
   computer |     3      |            |
            +------------+------------+
  ~computer |            |            |
            +------------+------------+

Now, if 12 students belong to the computer club, and we've already accounted for 3 of them, there must be 9 who are in the computer club, but NOT the photography club, right?

              photography ~photography
            +------------+------------+
   computer |     3      |     9      |  <- These have to
            +------------+------------+     add up to 12
  ~computer |            |            |
            +------------+------------+

Can you use similar reasoning to fill in the lower left box, given that 8 students belong to the photography club?

And once you know that, you know how many belong to neither club.

Does this make sense?
After this start, Autumn was able to finish; she wrote back:
Thank you so much. This makes perfect sense and now I feel silly. I was so stuck on the numbers that I couldn't think beyond to get over the hump. Great visual and clues! I appreciate your help.
I’d like to add one more thing that I find helpful with this kind of table (which is also useful in probability problems). I include a column and a row that hold totals, so we can put all the information in the table. Here is my table, with only the given information:
              photography ~photography  total
            +------------+------------+
   computer |     3      |            |  12
            +------------+------------+
  ~computer |            |            |
            +------------+------------+
      total       8                      30
After filling in the rest, by subtraction, we have
              photography ~photography    total
            +------------+------------+
   computer |     3      |     9      |  12
            +------------+------------+
  ~computer |     5      |    13      |  18
            +------------+------------+
      total       8           22         30
And there’s our answer: 13. (I’m still curious why this problem appeared in a section about proportions; possibly they had used tables of proportional values, and this was given as a contrast.)
Three sets
Here is a question from 2017 that serves as a good introduction to the more complicated 3-set case:
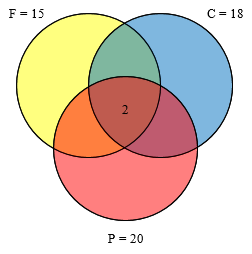
Some Drank All; Did All Drink Some?

At a meeting, 35 teachers were offered Fanta, Coke, and Pepsi.

Fifteen drank Fanta, 6 drank both Fanta and Coke, 18 drank Coke, 8 drank both Coke and Pepsi, 20 drank Pepsi, and 2 drank all three beverages.

How many of the teachers drank (i) Coke only? (ii) Fanta and Pepsi but not Coke?

I tried a little, but didn't get the answers. I have just forgotten how to solve these kinds of problems.
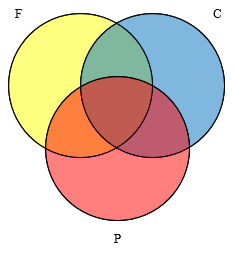
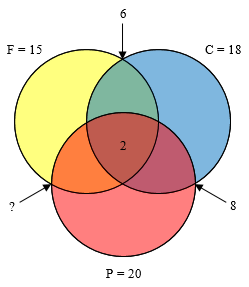
I started by making a Venn diagram, in which each circle represents all the people who drink a given kind of soda:
I usually start these problems by drawing a Venn diagram, and labeling what I can.

We need three sets, Fanta (F), Coke (C), and Pepsi (P):
I also like to make a table so I can see all the information clearly:

   Fanta:          15
   Fanta and Coke:  6
   Coke:           18
   Coke and Pepsi:  8
   Pepsi:          20
   all three:       2

When it says 15 teachers drank Fanta, that means Fanta AND possibly other refreshments. So that refers to the entire circle for Fanta, not just the region of the diagram that represents those who drank ONLY Fanta. Similarly, "Fanta and Coke" doesn't mean they didn't also drink Pepsi; it includes both the region for ONLY Fanta and Coke AND the "all three" region in the middle.

While the middle is all that we can fill in immediately, I'll also indicate each set's total next to its label:
(I didn’t mention it at the time, because I was making ASCII-graphic “circles” for which this is awkward, but when I do these problems on paper, especially some that are more complicated than this one, I like to label as much of the given data as I can, so I use arrows to represent the intersections of two circles, which will help in the next step.)
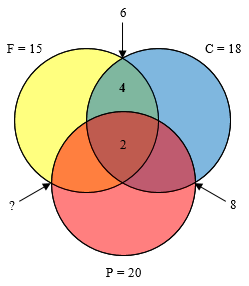
But now we can take each of the facts about TWO sets, and use subtraction to fill in other regions. For example, since 6 drank both Fanta and Coke, but 2 of those ALSO drank Pepsi, there must be (6 - 2 =) 4 who drank ONLY Fanta and Coke:
See if you can finish, by filling in the other two "double" regions, and then again using subtraction to fill in the three "only one" regions. Then you can use the diagram to answer the questions.

In trickier problems of this sort, more than just subtraction may be needed; but this problem is the straightforward kind, where you are given exactly the facts needed to make the diagram.
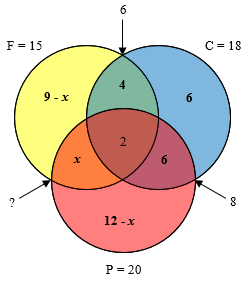
In preparing these pictures, I have realized that I missed an important feature of this problem: it doesn’t say how many drink Fanta and Pepsi, so we can’t continue quite as I said — this is one of the “trickier problems”, but I didn’t see that. What we can do is to label the missing intersection with a variable, and fill in everything else we can.
Now we realize that we can only proceed if we assume that everyone drank something. (The headline writer apparently noticed this!) If so, then the sum of the seven regions in the diagram is 35, and we have this equation to solve:
\((9-x)+4+6+x+2+6+(12-x) = 35\)
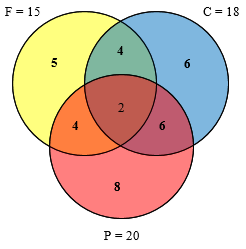
Solving it, we find that \(x=4\). Looking back at the questions, the first is already answered: the number who drank Coke only is the blue region, 6. The answer to the second question (how many drank Fanta and Pepsi but not Coke, is our \(x\): 4.
The typical basic problem would have included the number who drank Fanta and Pepsi, from which we would have more directly filled in everything, including how many drank nothing.
For an example of the basic kind (but with an algebraic method suggested), see
Venn Diagram - Fast Food Restaurants
Here is an example like mine above where a variable is needed:
Venn Diagram - Choose One of Three Options
Ambiguity
A key idea in the wording of these problems is that when they mention those who choose, say, Coke and Pepsi, they include those who choose all three. Sometimes, like the last link I gave, the wording is done very carefully. Other times, it can be unclear, as in this 2002 question:
Solving Questions

I got this challenging question in my Math course:

In a poll of 37 students, 16 felt confident solving quantitative comparison questions, 20 felt confident solving multiple choice questions, and 18 felt confident solving gridded response questions. Of all the students, 4 were confident solving gridded response and quantitative comparison questions, 5 were confident solving multiple choice and quantitative comparison questions, and 6 were confident with gridded response and multiple choice questions. Of those students, only 1 felt confident with all three types of questions. What number of students felt confident solving only multiple choice questions and no others?

I tried to solve this riddle, and I got 10. My teacher told me that the answer is actually 8. I just can't figure this out. Would you please tell me which one is the right answer, and explain to me how to solve such questions?
I started by pointing out the potential problem, and the conventional interpretation:
I am always uneasy with these puzzles, because they are never worded clearly enough for me. Which numbers are meant to be inclusive? The first three numbers are clearly inclusive (that is, 16 like AT LEAST QC, but possibly others), since otherwise the answer would be given directly. Then the next three numbers seem likely to be inclusive as well, so that 4 like both GR and QC, AND possibly also MC. That implication is further supported by the wording "of those students [the 4, 5, and 6?], only 1 ...." So my assumption, probably like yours, is that the 1 is included in each of those numbers, so that there are 3, 4, and 5 who like ONLY two types of questions. That makes it easy to fill in a Venn diagram, and we quickly see that the circle for MC, whose total size is 20, has 1 shared with both QC and GR, 4 with QC alone, and 5 with GR, leaving 20-(1+4+5) = 10 for MC alone. So I agree with your answer...
... except that if we then add up the total, we find that 40 students like something, out of 37 students in all! So our assumptions do not fit all the facts. Looking for something to reinterpret, I consider the possibility that the single student who liked everything might NOT be included in the 4, 5, and 6. Taking it that way, the number for MC alone is 20-(1+5+6) = 8, agreeing with your teacher's answer.

(And this time, the sum is 37 — meaning that every student felt competent in something.)
I think the problem is very poorly stated. You might like to try rewording it to make everything clear. That's a good exercise in communication, which mathematicians, pollsters, and puzzle-makers should pay attention to as well! (Except when a puzzle is deliberately vague to mislead you, which this one should not be.)
For a similar issue, see
Venn Diagram: Two Possibilities
Next time, we’ll look at a more complicated case.
Pingback: Venn Diagrams: Over the Top – The Math Doctors
Pingback: Venn Diagrams: Language Issues – The Math Doctors