
(An archive question of the week)
Last week we looked at a recent question that touched on the idea of the derivative as a rate of change. Let’s look at a long discussion from a few years ago digging into what that means within calculus.
Instantaneous rate, or rate per inch?
Here’s the question, from 2015:
Derivatives, and the Big Deal with Little Intervals

A problem in my book says, "Find the rate of change of volume of a sphere with respect to its radius when the radius is 6 inches."

I already know the mechanical way to solve the problem, and that is to find the derivative of V(r) = (4/3)*pi*r^3 to get 4*pi*r^2.

What my mind can't wrap around is the conclusion: "Hence, when r = 6, the volume of the sphere is increasing at the rate 4*pi*(6)^2 = 144pi cubic inches per inch of increase in the radius."

What does this conclusion even mean? Why is V(7) minus V(6) not equal to 144pi when the conclusion affirms that an inch of increase from 6 (that is, 6 + 1 = 7) corresponds to a 144pi change in volume?

Am I missing something, or did I just misunderstand the concept of instantaneous rate of change?
The question here is similar to what was discussed last time. Given the function $$V(r) = \frac{4}{3}\pi r^3,$$ we take the derivative and find that $$V'(r) = 4\pi r^2.$$ The rate of change at r = 6 is therefore $$V'(6) = 4\pi \cdot 6^2 = 144\pi \approx 452.39.$$ Tristan therefore expects that when r increases by 1, from 6 to 7, V should increase by\(144\pi\); but the actual increase is $$V(7) – V(6) = \frac{4}{3}\pi\cdot 7^3 – \frac{4}{3}\pi\cdot 6^3 = \left(169\frac{1}{3}\right)\pi \approx 531.98,$$ which is considerably larger.
The key, as you may observe, is the word “instantaneous”. Doctor Ian answered the “why” question:
Because it doesn't apply to a whole inch of change. It's a little like the way you can drive at a speed of 30 miles per hour, even if you don't drive for a whole hour. :^D

Let's look at smaller and smaller differences:

   V(7) - V(6)
   -----------  = (4/3)pi(7^3 - 6^3)/(7 - 6)        = 532
     7  -   6

   V(6.5) - V(6)
   -------------  = (4/3)pi(6.5^3 - 6^3)/(6.5 - 6)  = 491
     6.5  -   6

   V(6.1) - V(6)
   ------------- = (4/3)pi(6.1^3 - 6^3)/(6.1 - 6)   = 460
     6.1  -   6

   V(6.01) - V(6)
   -------------- = (4/3)pi(6.01^3 - 6^3)/(6.01 - 6) = 453
     6.01  -   6

   V(6.001) - V(6)
   --------------- = (4/3)pi(6.001^3 - 6^3)/(6.001 - 6) = 452.46
     6.001  -   6

   V(6.0001) - V(6)
   ---------------- = (4/3)pi(6.0001^3 - 6^3)/(6.0001 - 6) = 452.40
     6.0001  -   6

   V(6.00001) - V(6)
   ----------------- = (4/3)pi(6.00001^3 - 6^3)/(6.00001 - 6) = 452.39
     6.00001  -   6

... and so on.
These are the (average) rates of change over smaller and smaller intervals starting at 6.
Look at the rate, and not just the difference. Note that as the denominator of that rate approaches zero, the rate itself (i.e., the ratio) gets closer and closer to a limiting value.

What do you think that value is going to turn out to be?
We can see that the numbers are approaching something around 452.39, which we saw previously is the derivative. That is, the rate of change over a very small interval is, essentially, the instantaneous rate of change.
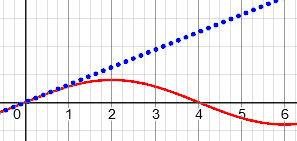
This is what we MEAN by "instantaneous rate of change." If we draw the curve for volume versus radius, it looks something like this, right?
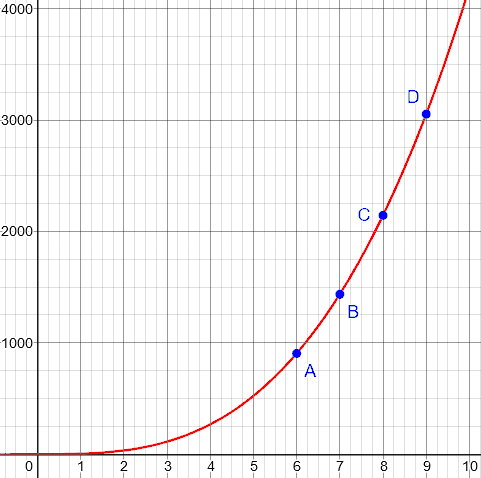
(I’ve updated his rough graph!)
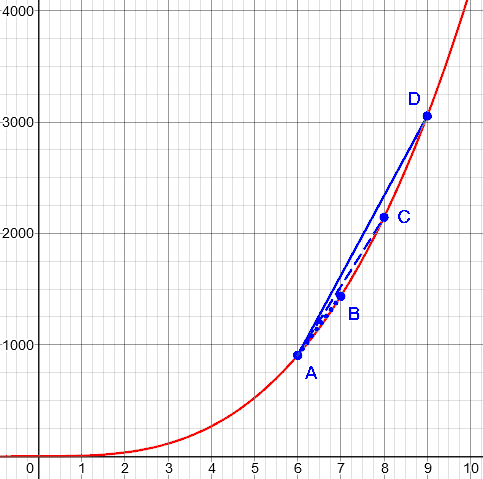
Now, let's say that we look at some average rates of change, i.e., from A to D, from A to C, from A to B, and so on. To find the average rate of change, we divide the change in y by the change in x, e.g.,

    y_D - y_A
   -----------
    x_D - x_A

Each time we do that, we get the slope of the line connecting A and D, or A and C, or A and B, and so on.

And each of those slopes is different. So the average rate of change depends on what interval we calculate it over. (Note that for linear functions, the average rate of change is the same anywhere. For other functions, this is not the case.)
We’re looking at these slopes:
But we can ask: Suppose we let our other point get closer and closer to A. What happens? And we find that for lots of functions, as the denominator approaches zero, the rate itself converges to a particular finite value -- the "instantaneous rate of change."

That is, the instantaneous rate of change is the limit of the average rate of change as the interval over which the change is measured drops to zero.

Does this clear anything up?
But a change has to be between two points!
Tristan replied:
Thank you, Dr. Ian, for clearing things up. :)

Oh, and one more thing. Why is it called instantaneous rate of change when we're focusing on a single point in the curvy graph? Doesn't change imply two points?
Doctor Ian responded:
Yes, and we're always using two points. We're just letting that second point get arbitrarily close to the first one, without ever getting all the way there. This only works because there is a limiting value.

So one way to think of it is this: We can get as close to that limiting value as we want, by putting the second point sufficiently close to the first. So we just go ahead and use the limiting value.
Why do we care about small changes?
Tristan wasn’t quite satisfied:
Sorry for bothering again. I promise this will be the last question.

Regarding the very small increases in radius (6, 6.01, 6.001, etc.), what exactly is the reason why we should be interested in these small changes when in the real world, big increases are what matter (i.e., rate of change of volume when radius becomes 7, 8, 9, etc.)? Doesn't 144pi only apply to 6 and the very small intervals before and after 6?
(This wouldn’t actually be the last question; that’s okay!)
Doctor Ian replied:
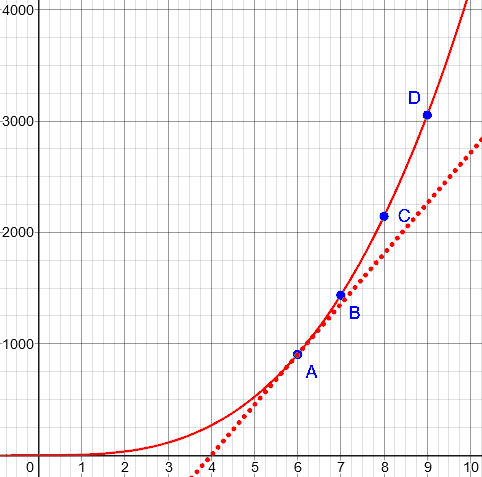
Sure -- and this illustrates the danger of extrapolating from the current value and rate.

If you have a linear function, then the rate is the same everywhere, so you can multiply the slope by the change in x to get the change in y. But if you don't have a linear function, and you look at the current rate, and try to extrapolate that linearly, you can be way off.

Look again at the curve for the volume of a sphere:
If I use the average rate between A and B to project what's going to happen at a later time, it's not going to give me such a great answer, is it? Similarly, if I use the average rate between C and D to project what's going to happen at an earlier time, that's not going to work out so well either.
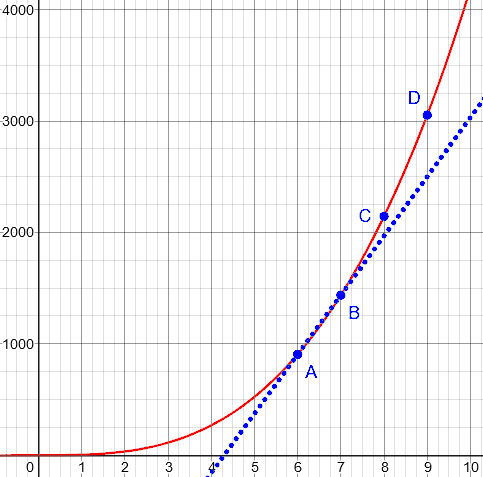
Here’s what it looks like using the instantaneous rate:
There, nothing fits exactly; but the approximation gets better, closer in.
For larger changes, we have at least a couple of options. In the case of the sphere, we already have the formula for the volume, so there's no need to try to project the change from one radius to another.

If we did want to accumulate changes, and we had the derivative, then we could integrate -- that it, accumulate all those small changes, which in the limit gives us an exact result without any extrapolation error.
Integration is the inverse of differentiation; it adds up small changes that are themselves changing.
But why would we have the derivative, but not the actual equation? That’s where things get interesting:
The laws of nature are usually about small changes
Also, as to the reason why "we're interested in these small changes," the deep answer is that almost all the laws we know about nature are expressed not in terms of formulas like the one for the volume of the sphere, but in terms of CHANGES of various quantities, i.e., in terms of derivatives. That is, the rules of nature seem to tell us not what quantities are, but how they change, and how changes in some quantities relate to changes in other quantities.

(To take a very basic example, Newton's law F = ma tells us the relationship between force and the SECOND DERIVATIVE of position.)

So really, when you get down to it, at least when it comes to science, "small changes" are all we have to work with.
To put it another way, the book of nature is largely written in differential equations, that tell how a change in one quantity affects others.
Approximation, limits, and extrapolation
Tristan returned to the original question:
Thank you for the insight regarding our "interest in very small changes."

Going back to the problem from my book, is it then safe for me to say that 144pi is the instantaneous rate of change of volume for radii very, very proximate to 6? or is 144pi the AVERAGE rate of change of volume for radii very, very proximate to 6?

What I'm trying to imagine is to expand the sphere from r = 5 to r = 7. Now, it seems to me that the 144pi rate of change of volume becomes irrelevant for 5.001, 5.0001, 5.59999, 6.3333, 6.5555, 6.9999, etc. as the sphere expands through these radii. 144pi, hence, only applies to values like 5.899999, 5.988888, 6.0001, 6.00002, etc., which are very close to 6; but the sphere only takes less than a second for it to have these radii as its radius grows toward 7, making 144pi short-lived.

Sorry for being so abstract but is this the proper way to treat the concept of instantaneous rate of change?
Doctor Ian first responded to the question of how close you have to be:
If you want to be precise, it's the LIMIT of the average change as the interval over which the average is taken approaches a size of zero.

What makes calculus work is that for a large range of functions f(x), we get into a situation where this approaches either a constant value, or some function that we can calculate:

                 f(x + h) - f(x)
  f'(x) = Limit -----------------
   h->0           (x + h) -  (x)

If you're calculating derivatives, can I assume that you've seen this sort of thing before?

What this tells us is that, as we make h smaller and smaller, we keep converging to a particular value or function, even if we never actually reach it. By "converge," we mean it always gets closer, and never moves away.

And so IF we were to let h get all the way to zero -- even though we can't -- we know where it's going. So we skip right to the destination, as it were.
How about the question of irrelevance to numbers distant from 6?
I wouldn't say that it becomes "irrelevant" so much that as you increase the size of the interval, the difference between the linear projection and the actual function diverges. You still get a prediction, and the prediction has some of the desired features (e.g., as the interval gets larger, so does the projected volume). But it's not a very good prediction.

Here's an example. Suppose you notice where the edge of the ocean is one day, and put a stick in the sand to keep track of that. A few hours later, you put another stick in the sand to measure the new edge. You do a quick calculation, and realize that in a few days, most of the eastern United States will be under water!

When you hear people warning of the dangers of extrapolation -- especially linear extrapolation -- this is the kind of thing they're talking about. When you have someone running around saying Manhattan will be submerged by dinner time, it's just funny. On the other hand, when you have bureaucrats making far-reaching decisions about public policy after doing essentially the same kind of extrapolation, it can be incredibly damaging.
This example is an extreme of extrapolation, where the actual function (the tide) goes up and down, and we are trying to approximate it with a straight line. The approximation might be good within an hour or two, but not into the next cycle:
Isn't this exactly what you should infer from the fact that when you calculate the derivative at different inputs, you get different derivatives? The rate of growth is different everywhere, unless the function you're dealing with is linear.

In particular, if you use the radius and rate at 6 to predict the volume at 7, you'll get the wrong value. If you use the radius and rate at 7 to predict the volume at 6, you'll also get the wrong value.

If you use the radius and rate at ANY particular radius, you'll make the wrong prediction for any other radius. And the farther apart your initial and final radii are, the worse your prediction will be.
So approximation by the derivative only works within some interval around the given point. But sometimes that’s good enough:
But what if it takes more than a second? For example, what if we're plating the sphere with some kind of metal? Or the size of the sphere is being slowly increased by the growth of coral around it? What if the sphere we're talking about is a black hole forming in the heart of a galaxy? Now we're talking about some pretty small rates of growth, and in those cases, the prediction from now to any reasonable time after now might actually be "good enough for government work," as they say.
Keep in mind that the original problem said nothing about time; it was about the rate of change of volume with respect to the radius. If the radius grows by an inch a second, Tristan is right; but slow growth might mean the approximation is good for hours or for years.
What is the speed right now?
Sometimes it can help to change domains slightly, to one where your common sense can help you out. Let's say that, instead of talking about the volume of a sphere, our cubic function tells us how far a car has moved as a function of time:


   Distance
   ^
   |

                  D        .
                         .
                       .
                     .
                 C .
                 .
               B
             A
          *
    *
                                --> Time


To make it more interesting, let's say that we don't have an exact formula that relates time to distance. We just see, from some measurements, that it's increasing like in the picture. Maybe it's quadratic, maybe it's cubic, maybe it's exponential, maybe it's something more complicated.

But here's what we can say. As we let points A and B move closer together, it makes intuitive sense, doesn't it, to say that the average speed that we're calculating is closer to what we would mean by "the speed of the car at time A"?  Not "at and just after" that time, or "around" that time, but actually AT that time?

(When you're driving, and you look at your speedometer, do you think "my average speed over the last little bit of road was 32 miles per hour"? or "my speed right now is 32 miles per hour"? The former is actually more correct, but the latter is how we THINK about it, no?)

And how confident would you be about using "the speed at time A" to calculate the position of the car at times B, C, and D? The farther into the future you try to predict the location, the worse your prediction will be, right?
This is all common sense: We can’t literally calculate the car’s speed at a single moment, yet the concept makes sense, even though the speed may be constantly changing, and our average speed over the next minute or hour will not be what the speedometer shows right now.
To export the reasoning of the tide example to this context, suppose I'm heading off to California, and I am going 10 miles per hour as I leave my driveway. Should I then predict that the time I'll need to reach California will be more than twelve days?

   3000 miles/10 miles per hour = 300 hours

Or if I am passing someone on the highway, and temporarily get up to 100 miles per hour, can I conclude that the remaining 2000 miles will take me less than a day?

   2000 miles/100 miles per hour = 20 hours

In general, the rate at which something is changing at a given moment only tells you what is going on at that moment. That's not some strange attribute of derivatives. It's just how the world works.

Make sense?
Rate need not relate to time
Tristan was satisfied there, but his next query brought up another issue:
The car example greatly helped, especially the last statement: "In general, the rate at which something is changing at a given moment only tells you what is going on at that moment." :)

So if I put the sphere and the car example in an analogy, a car's instantaneous velocity corresponds to the sphere's instantaneous rate of change of volume, is it not? A speedometer corresponds to a meter which captures the sphere's particular rate of change of volume at a particular time, right?
Doctor Ian agreed with the analogy:
It is. They're both rates of change of one quantity (distance, volume) with respect to another (time, radius).
But he wanted to point out a difference pertaining to the “meter”:
I wonder if this is where you're getting a little lost. Rates of change are not always measured with respect to time, although informally we tend to use "rate" that way.

Anytime we have two quantities that are changing together, we can talk about the "rate" at which one is changing "with respect to" the other. And all we mean by that is the slope of the graph that shows one as a function of the other.

Sometimes the two quantities are related by a formula, like in the case of the volume of the sphere. But think of something more complicated. Suppose we increase the volume of a sphere by pumping fluid out of a cylindrical container into a spherical bladder.
After giving a different example, he concludes:
Generally, though, we are often interested in situations where a change "over here" creates a corresponding change "over there." (That's really the essence of experimentation, isn't it?)

This is why we are interested in derivatives; and because most of these situations are non-linear, we must pay attention to "small changes," because using linear approximations to "big changes" leads us astray -- often disastrously so.
We might say, the reason we care about small changes is that without understanding them, we won’t get the big changes right. And if we confuse the two, we’ll be in even bigger trouble.
Pingback: What is a Derivative? – The Math Doctors