
(An archive problem of the week)
Having just discussed quartiles, I want to look at related issues concerning percentiles. There, I briefly mentioned different perspectives on the concept of quartile, and focused on differences in the details of the calculations; here I will focus mostly on the different perspectives, and then touch on variations in the calculation.
Percentiles, ranges, and ranks: 0 to 100?
Here is the question, from 2014:
Percentiles, from Top to Bottom

I understand that the highest possible percentile is the 99th percentile, as it comprises the top 1% and it is above the other 99%.

If each percentile comprises 1% of the population, then there must be 100 percentiles. If there are 100 percentiles, and the highest is the 99th, then what is the lowest percentile? the 0th percentile?

I've never heard of a 0th percentile; yet if my above description is correct, it must exist.
In order to answer this, I first had to untangle several distinct perspectives on the word “percentile”.
Percentiles are defined in several different ways, and you will see the 0th percentile (and also the 100th percentile) mentioned quite often if you do a search. I haven't found a source I can refer you to that clearly delineates all the ways I've seen it used, but several sources make it clear that there is no universal definition, and that percentiles are commonly taught -- and used -- loosely.

As I see it, there are three things that are typically called percentiles, which I distinguish by "is, at, or in":

1. Percentiles: A data value that IS a specified percentile.

   For example, we might say that the 10th percentile
   on a test is 54. (In this sense, the 0th and 100th
   percentile definitely exist.)

2. Percentile ranks: Percentile AT which a data value lies.

   For example, we might say that a score of 57 lies
   at the 10th percentile, which we find by rounding
   the actual percentage of scores that are less than
   57. Sources vary on how to round.

3. Percentile ranges: One of 100 equal parts that a data value is IN.

   For example, we might say that 57 is in the 10th
   percentile, which runs from 55 to 59.

Your question is about the last of these. Though it is often equated with the second without comment, it is this version that good mathematical sources address least.
The first and last views both start with the percentile: Given, say, the term “19th percentile”, we want to know where it is (a specific number we want to find), or what numbers are in it (an interval we want to identify). The intervals called percentiles are separated by the numbers called percentiles. (But are these numbers in the intervals, or between them?) The middle view starts with an individual data value, asking what percentile it lies at; but it can also be thought of as asking which percentile interval it is in, which almost sounds like the last view. So these distinctions can get rather fuzzy!
Because I hadn’t found any good sources that directly talked about this, I had to go by my own reasoning to talk about the percentile ranges:
It would seem most natural to me to call these 100 intervals the 1st through 100th; but it seems to be common to conflate this concept with the second one above, taking the percentile rank to be the percent of data that lie below the given value, and rounded down to a whole number. The result of this definition is that no percentile can be 100, and the lowest WILL be the 0th percentile.
Since I had made up these categories, to some extent, in order to make sure they are not just my own ideas, I had to do some research, looking for how the word is actually used, and for definitions from reliable sources. Here I chose to refer to Wikipedia; what I quoted here has since been modified, emphasizing further the variability of the definitions.
The following pages discuss my first two definitions (my emphases marked by *asterisks*):

   http://en.wikipedia.org/wiki/Percentile

   A percentile (or a centile) is a measure used in
   statistics indicating the value below which a
   given percentage of observations in a group of
   observations fall. For example, the 20th percentile
   *is* the value (or score) below which 20 percent of
   the observations may be found. ...

   One definition of percentile, often given in texts,
   is that the P-th percentile (0 <= P <= 100) of N
   ordered values (arranged from least to greatest) is
   obtained by first calculating the (ordinal) rank ...

       n = P/100 * N + 1/2

   ... rounding the result to the nearest integer,
   and then taking the value that corresponds to
   that rank. (Note that the rounded value of n is
   just the least integer which exceeds P/100 * N.)

   The 100th percentile is defined to be the largest
   value. (In this case, we do not use the above
   definition with P = 100, because the rank n would
   be greater than the number N of values in the
   original list.)

[Note that the percentile in this sense can be 0 or 100.]

   http://en.wikipedia.org/wiki/Percentile_rank

   The percentile rank of a score is the percentage
   of scores in its frequency distribution that are
   the same or lower than it. For example, a test
   score that is greater than or equal to 75% of
   the scores of people taking the test is said to
   be *at* the 75th percentile rank.

   The mathematical formula is (c_l + 0.5 f_i) / N * 100% .

[Note that this page, like many, does not say how to round, yet always
gives whole number ranks. It is the rounding that determines whether the
percentile rank can be 0 or 100! Many sources declare that neither 0 nor 100 exists, even though the formula they give, with any kind of rounding, will yield at least one of them.]
Note that, as stated (without rounding), the formula given for percentile rank can never yield 0 or 100; but with rounding, and a large enough data set, it can. (This formula will be the subject of the next question.)
The first reference also seems to be talking about my third meaning, using
the word "in," though that does not fit the definition they just gave:

   The term "percentile" and the related term
   "percentile rank" are often used in the reporting
   of scores from norm-referenced tests. For
   example, if a score is *in* the 86th percentile,
   it is higher than 86% of the other scores.
As I read this, a score in the first percentile must be greater than (at least) 1% of the data; so anything in that first percent must be in the 0th percentile. But nothing could be in the 100th percentile. This implies what I said above, rounding the percentage down, so that if a value is greater than 1.5% of the data, it would be said to be in the first percentile.
Looking at the current Wikipedia page for Percentile, I see that it shows a number of different ways to define the concept. One important paragraph is this:
There is no standard definition of percentile, however all definitions yield similar results when the number of observations is very large and the probability distribution is continuous. In the limit, as the sample size approaches infinity, the 100pth percentile (0<p<1) approximates the inverse of the cumulative distribution function (CDF) thus formed, evaluated at p, as p approximates the CDF.
This issue is also discussed in the Langford article I discussed last time.
Moving from Wikipedia, I found a more technical source:
Here is another definition of my first version:

  http://www.itl.nist.gov/div898/handbook/prc/section2/prc252.htm

  The pth percentile is a value, Y(p), such that at
  most (100p)% of the measurements are less than this
  value and at most 100(1 - p)% are greater. The 50th
  percentile is called the median.

  Percentiles split a set of ordered data into
  hundredths. For example, 70% of the data should fall
  below the 70th percentile.

Note the use of "at most," which is necessary in order to make the definition work. In particular, the lowest and highest values are the 0th and 100th percentiles.

It does NOT say that 100% of the values are LESS than the 100th percentile; the "should" in the last sentence above is a general statement, not the actual definition.
This agrees with conclusions I discussed in my post about medians. It gives a proper definition (not just a procedure), which allows for variation (“a value”). Note that the common elementary definition of percentile yields a 50th percentile that is not the same as the median; some of the variations are intended to fix this.
I also notice that this paper subtly takes note of the distinction I made:
Given n points, the percentile corresponding to the i-th point is i/(n+1).
More typically we start with a desired percentile value and this percentile of interest may not correspond to a specific data point. In this case, interpolation between points is required. There is not a standard universally accepted way to perform this interpolation. After describing our default method, several alternative methods are given. All of the methods discussed here are used in practice.
The first statement here is percentile rank, my “at”: starting with a data value and finding its percentile. (Their formula is simplistic, and doesn’t mention rounding, evidently because it is not important enough at this level to elaborate.) The second is my “is”: starting with a percentage and finding a value corresponding to it. This kind is important enough to describe several methods (which I will look at below). There is no mention here of percentile ranges (my “in”).
Anyway, having said all this in quest of a good source, all I can really say is ... it depends on what definition you are using -- and most people have sloppy definitions when they talk about being IN the nth percentile.
Percentile rank: halvsies
At the end of my answer to that question, I referred to an earlier question (2009) that brought up a specific issue in calculating percentile rank, namely the reason for the formula I quoted from Wikipedia:
Calculating Percentile Rank

Percentile rank means the percentage of scores that fall "at or below" a certain number.  If more than one data value matches the number, why do we only count half of the data values when calculating the percentile rank?  ie:  10, 11, 12, 12, 12, 12, 15, 18, 19, 20.  Why is the percentile rank of 12 calculated at 4/10 instead of 6/10 since there are 6 data values that fall "at or below" 12?
Susan started with the brief definition of percentile rank, but indicated that she has been taught the same formula given in Wikipedia above (and quoted again below).
I started with a disclaimer:
Percentile is not always defined exactly the same way; there are some tricky details, especially when you want to apply the concept to a small "toy" data set like this one. In real life, you would apply it to, say, 30,000 scores on a standardized test, and this sort of problem goes away.
I then referred to the Wikipedia article on percentile, with my “is” and “in” senses:
That discusses percentile in the sense of "what value is at the nth percentile (where n is a whole number)?" This gives 99 points that divide a large data set into 100 equal parts, so that any value between the p/100th and the (p+1)/100th is considered to be "in" the pth percentile. The adjustments in the definitions are needed to deal with cases where N is not a multiple of 100, so that the calculations do not point to individual values.
Then I moved on to the actual question:
What you are asking about is percentile rank, which is somewhat different from that; it asks "at what percentile (again, a whole number) is this value?"  Here the problem with a small data set (or a large set with few possible values) is that the same value may appear in more than one "percentile" in the above sense.  We have to decide which one we should use--the first? the last? the middle?

The following article gives your definition in symbolic form without further explanation, and contrary to its earlier definition in words:

  Wikipedia: Percentile Rank
  http://en.wikipedia.org/wiki/Percentile_rank

Where does this come from?
There c_l is the number of scores lower than the score of interest, f_i is the number of scores equal to the score of interest, and N is the total number of scores.  So you are counting all scores below, and half the scores at, the given value in finding the percentage.

This definition makes good sense to me.  Basically, they don't want to be biased toward either the first data point with the given value (the number of values BELOW 12, namely 2/10 = 20%) or the last (the number of values AT OR BELOW 12, namely 6/10 = 60%; this can also be taken as 100% - the number of values ABOVE 12, which gives 100% - 40% = 60%).  So they essentially take the average of the two.  They are splitting the difference between the two possible definitions.

In other words, the MIDDLE of the 12's best represents where the 12's as a group are "at", better than either the first or the last of them.
Susan responded,
Thank you for your very detailed answer to my question regarding percentile rank. I have referenced many textbooks regarding percentile rank, but none of them have explained "why" half of the repeating values are counted, they simply tell you to only count half of them. I am a 9th grade algebra teacher and I like to tell my students the "why" behind formulas, definitions, etc. because I think they are more apt to remember if they understand the "why." I whole-heartedly appreciate the time and effort you put into responding to my question (a question that has taunted me and my colleagues for a long time).
How much difference does it make?
Let’s take a closer look at the relationship among various perspectives on percentiles, and different definitions.
Using Susan’s data (which are particularly easy to work with, having exactly 10 numbers), we can first look at percentile ranks (“at”). If we put the data on a number line, what percentile do we get for each value? Wikipedia only gives one rule for percentile rank, but we can also follow the naive rule given in the many elementary textbooks and stated in words in Wikipedia, “the percentage of scores that are equal or lower”; NIST’s briefly mentioned rule; and two functions provided by Excel, called “inclusive” and “exclusive” for percentile rank. Here are the results:
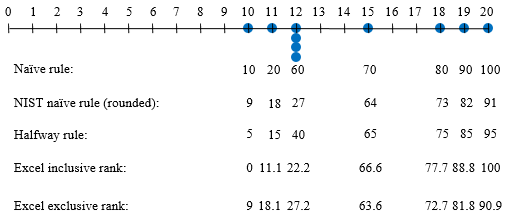
The inclusive version allowss both 0 and 100; both Excel versions use linear interpolation. All, of course are different. Which is “right”? That’s a question for others to answer.
Now, let’s use several versions of percentile values (“is”) to find the boundaries of percentile ranges (“in”). The current Wikipedia gives several definitions, starting with the “nearest rank method” (“often given in texts” because it is simple), which is just a little different from what I originally quoted. This is followed by several variations of “linear interpolation between closest ranks”, used by Matlab, Excel (inclusive), and Excel (exclusive), and also referred to by the NIST paper I had mentioned.
First, the “nearest rank method”; here we just take the given percentage of N, round up, and use that index. This always yields a number in the data set, which can be the same for different percentiles, for small amounts of data, so that I have indicated a range of percentiles all at the same location:
By this definition, none of our data values are actually in any percentile range. NIST gives a variant in which, if you get an integer, you average that value and the next:
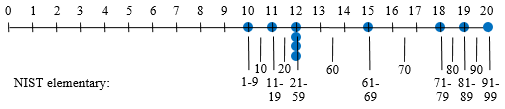
This makes it clearer that the tenth percentile (range) is from 10 to 10.5, and that the number 10 lies within the bottom 10 percentiles.
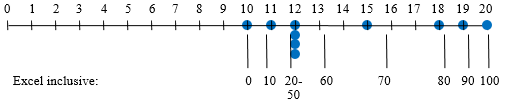
Excel, as Wikipedia mentioned, has two different percentile functions, both of which are interpolated to ensure that each percentile is distinct. PERCENTILE.INC includes 0 and 100, and gives the following values for multiples of 10:
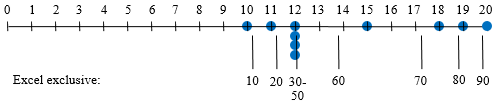
The exclusive function, PERCENTILE.EXC, gives an error for percentiles near 0 or 100; it shows the following:
I think the main lesson from this is that percentiles should not be looked at too closely for small data sets such as we tend to use in teaching! And the percentiles that are actually used in technical fields are far more complicated than the basic ideas we teach. On the other hand, we should emphasize that percentiles make good sense where they are actually used, such as in standardized test scores, where none of the issues we have looked at make any difference.
Pingback: Why does standard usage of "percentile" vary from other _iles (quartiles, deciles, etc.)? - English Vision