
(An archive question of the week)
Last time we looked at a formula for approximating the mode of grouped data, which works well for normal distributions, though I have never seen an actual proof, or a statement of conditions under which it is appropriate. We have also received questions about a much more well-known, and well-founded, formula to estimate the median. Here, it is possible to give a solid derivation, and to clearly state the assumptions on which it is based.
The basics
Here is the initial question, from 2007:
Derivation of Linear Interpolation Median Formula

Median,  m  =  L + [ (N/2 – F) / f ]C.

How does this median formula come?  My teacher did not show and proof how does this formula come.  Therefore, I just substitute and blindly use the formula.  Can you help me?

This formula is used to find the median in a group data with class interval.  The median is the value of the data in the middle position of the set when the data is arranged in numerical order.  The class where the middle position is located is called the median class and this is also the class where the median is located.  This formula is used to find the median in a group data which is located in the median class.

Median,  m  =  L + [ (N/2 – F) / f ]C

  L means lower boundary of the median class

  N means sum of frequencies

  F means cumulative frequency before the median class.
    Meaning that the class before the median class what
    is the frequency

  f means frequency of the median class

  C means the size of the median class

I have tried to use an ogive graph to understand, but I still did not get how did this formula come.
Daya recognized that the formula is related to the ogive (also called the Cumulative Distribution Function, or CDF), but wasn’t able to complete the derivation. The formula is, again, $$m = L + \left( \frac{\frac{N}{2} – F}{f}\right)C.$$ For a well explained source, see
Math is Fun: Mean, Median and Mode from Grouped Frequencies,
which I referred to last time; this says, under Estimating the Median from Grouped Data,
Estimated Median = \(L + \frac{(n/2) − B}{G} × w\)
where:
- L is the lower class boundary of the group containing the median
- n is the total number of values
- B is the cumulative frequency of the groups before the median group
- G is the frequency of the median group
- w is the group width
I answered with a statement of what the formula does, and a quick derivation:
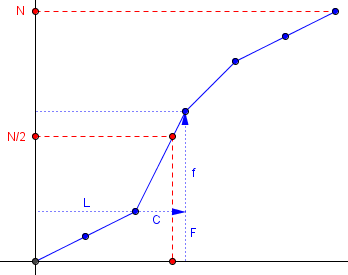
This is a linear interpolation (on the ogive graph, as you suggested), which finds where the actual median WOULD be if you assume that the data are uniformly distributed within the median class.

One way to derive the formula is just to note that N/2 is the number of data values BELOW the median, so N/2 - F is the number of data values in the median class that are below the median.  Therefore, (N/2 - F)/f is the fraction of values in the median class that are below the median.  This times C is that fraction of the class width; adding L gives the value at that position in the class.

In terms of the ogive (cumulative distribution), let's first just plot the actual cumulative frequency before each class, something like

  N+                             *
   |                        *
   |                   *
   |
   |              * ---
   + . . . . . .     ^
   |                 |f
   |                 v
  F|         *      ---
   |    *
   *----+----+----+----+----+----+
             L
             |<-->|
                C

We don't know where the actual data points are, but if they are uniformly distributed within each class, we could connect the points above with straight lines. Your formula gives the x coordinate corresponding to y=N/2. See if you can derive it this way.
Our formula gives the x-coordinate of the point on the graph where y = N/2. Here is a better version of the graph:
A specific example for clarification
In 2016, another student, Pramod, asked about the same formula, giving his own derivation that led to a slightly different formula:
Given this frequency distribution table:

   60-70          4
   70-80          5
   80-90          6
   90-100         7
  ------------------
             n = 22

I used the following rationale to calculate the median.

Median data entry = (22 + 1)/2
                  = 11.5th entry from first
                  = 11.5 - 9
                  = 2.5th of 6 entries through 80-90

Now, since I don't know the 6 data entries of median class, I assumed that they were distributed equally through 80 to 90 (10 class width):

   81.667, 83.333, 85, 86.667, 88.333, 90

I used these in the formula

   Median = L + {(n + 1)/2) - c.f.} * (h/f)

Here,

        L = lower limit of median class
        h = class width
     c.f. = cumulative frequency up to the preceding class
        f = frequency of median class
        n = total data entries/summation of frequencies

I got

   Median = 2.5th data entry
          = (83.333 + 85)/2
          = 84.1667

But in almost every statistics book I have ever studied, the formula for calculating median from a continuous frequency distribution table is given as

   Median = L + {(n)/2) - c.f.} * (h/f)

I know very well that the median calculated from such data is not exact, since we know only the range of data entries -- not the actual data entries, themselves. But still, does't it make more sense to use my formula? Doesn't it give a more precise approximation? If you agree, why is the latter formula used in almost every textbook?
This was an excellent attempt, and just missed two details. I responded by first referring to the answer above (to which this question was later attached):
I discussed this formula for Daya, above, but I didn't go into the details of the derivation to confirm that that formula could not be improved upon.

I have a small problem with your example: you didn't clearly state how to interpret your classes.

Let's take a closer look at your data.

   class        freq
   -----        ----
   60-70          4
   70-80          5
   80-90          6
   90-100         7
                ----
             n = 22

Which class is 70 in? I will assume that 80-90 means 80 <= x < 90, as is commonly done for continuous data; if the values are integers, then the class could also be described as 80-89 (inclusive), but then our estimate would have to be rounded to an integer, so we would not get a similar formula.
When classes are described in terms of integer values, the lowest and highest values in a class are called the class limits. But in a formula such as this, we need to treat the data as continuous, so we use, not these class limits, but the class boundaries, which are real numbers halfway between classes. Here, the lower boundary of the median class would be 79.5, which is 0.5 below the lower limit, 80. (Note that the word boundary is used in both statements of the formula above.)
I didn’t take this distinction into account in my answer to Pramod; and his work suggests that he is in fact assuming continuous (real number) data.
The principal error in Pramod’s derivation was including the lower limit (or boundary) of the next class in the median class:
If the 6 values in the class 80 <= x < 90 are evenly spaced across these 10 units, then they are spaced 10/6 = 1 2/3 units apart.

I would center them like this:

     5/6  __5/3__   __5/3__   __5/3__   __5/3__   __5/3__   5/6
    /  \ /       \ /       \ /       \ /       \ /       \ /  \
        *         *    |    *         *         *         *
   +-----+-----+-----+-----+-----+-----+-----+-----+-----+-----+
   80    81    82    83    84    85    86    87    88    89    90

Therefore, the 2.5th value is 83 1/3 -- that is, 80 + 2*5/3, not 80 + 2.5*5/3.

The standard formula gives

   Median = 80 + [(22/2) - 9] * (10/6)
          = 80 + 2*5/3
          = 83 1/3

This agrees with my answer.
If I had used the class boundary assuming integer values, the median would be $$m = L + \left( \frac{\frac{N}{2} – F}{f}\right)C = 79.5 + \left( \frac{\frac{22}{2} – 9}{6}\right)\cdot 10 = 82 \frac{5}{6}.$$ Everything in my line graph below would be shifted left by 1/2.
In the page above, the implication is that we would use the continuous CDF (for your example) like this:

   n=22|                   *
       +                  /
       |                 /
       |               /
       |              * ---
       |             /   ^
     11| . . . . . .     |f=6
       +          /      v
    F=9|         *      ---
       |       /
       |      /
       |    *
       |  /
      0*----+----+----+----+
       60   70   80   90  100
                 |<-->|
                  C=10

Linear interpolation puts the median 2/6 of the way from 80 to 90, giving 83 1/3 again.
Here is a more accurate graph:
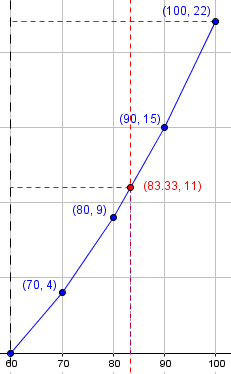
The graph vindicates the formula.
The difference between my first approach and yours is that I was a little more careful to distribute the values uniformly within the entire interval; whereas your last value is right at the end of the interval (and, I think, really in the next interval!). The fact that this results in the same answer obtained for a piecewise-linear CDF is encouraging.
Note, though, that if we really had integer data, we couldn’t uniformly distribute 6 values across 10 units; that’s another sense in which the formula is only approximate. It necessarily assumes a continuous distribution, in addition to the piecewise-linear CDF.
Good. Except the class size here is not 10 but eleven.
60-70 has a width of eleven numbers. This makes your median to be 83.2.
That would be true if the classes had been given as
60-70: 4
71-81: 5
82-92: 6
93-103: 7
That way, the first class would contain the 11 numbers 60, 61, 62, 63, 64, 65, 66, 67, 68, 69, 70, and the next would start with 71.
But that is not what Pramod said. What he did say would include 70 in two classes, 60-70 and 70-80, if it meant what you are assuming, namely a discrete distribution in which the range is given inclusively.
That’s why I said, “Which class is 70 in? I will assume that 80-90 means 80 <= x < 90, as is commonly done for continuous data.”
In order for the classes to make sense, we have to interpret them in the continuous sense, with 60 and 70 being class boundaries (division points between intervals), not class limits as you are taking them (lowest and highest values in the class). And that implies that the class width is indeed 10, just as Pramod said. Pramod’s error was a little more subtle than that, as I explained in the post, namely including both boundaries in a class, as if they were class limits.
So what I said was correct.
Hi Sir, if 60-70 = 4 Where is four from?
Thanks
That line is part of the problem as given, namely a frequency distribution. It means that there were 4 times when some quantity was between 60 and 70 (which I interpreted as meaning 60 ≤ x < 70). It does not mean that 60 - 70 = 4, of course. It's a notation that is read as "60 to 70". For an introduction to the concept, see here.
The issue of boundaries and class limits have been an issue to both teachers and learners.
The boundaries of nations can be applied as a teaching aid. The no man’s land is described by the two extrees otherwise the class limits.
The theories of approximations can also be applied. Absolute error is half the least unit of measurement.
80—-83 class, AE =0.5
Lower limit is 79.5.
Sir, I am a 10 grade student from India. I was not able to understand that while uniformly distributing the data over the median class, why did you take the first and last gap as 5/6 and all other gaps as 5/3? As we have to distribute the data uniformly, shouldn’t all gaps be equal?
Also sir, while drawing the ogive graph above, according to my understanding the point (80,9) represents that the 9th observation is assumed to be 80. But sir shouldn’t it be corrected as (80,10) because the 9th observation belongs to the previous class of 70-80, and the 10th observation belongs to 80-90? Please explain. Awaiting for your kind reply. Thanks.
Hi, Aditya.
First, on the gaps: That’s a fair question; to me it seemed obvious, perhaps from experience spacing pictures evenly on a wall, but it does deserve explanation.
One way to think of it is that I want each point to be in the middle of an equal region, so in effect I divided the class into 6 equal parts and put the data points at the center of each. In the example, the first region would be from 80 to 80 + 5/3, and the middle of that is at 80 + 5/6.
To make it more visual, here is a simplified example in which I have two classes, each 12 units wide, and I want to put 3 points evenly spaced in each. If I made all gaps equal, including those at the end of a class, I would divide by 4 (since there are 4 gaps) and space the points 3 apart in each class:


But instead, I divide by 3 (since there are 3 points), and put each point in the middle of an interval with width 4:
Which looks more evenly spaced? The latter, I think! The spacing to the end points of the classes is not meaningful; the spacing between data points is. At the boundaries of a class, that spacing is shared with the adjoining class, which is why we want half as much.
Now, on the ogive: Actually, we are assuming that no data point is exactly 80 (just as in my pictures above I put no data points at the boundaries). The point (80, 9) represents the given fact that 9 data points are less than 80. (That is, 4 + 5 are in the previous classes.) This is what the CDF means. It does not imply that the 10th is at 80.
But in your thinking about this, keep in mind that nothing we do can be exact, because we don’t know the actual data points anyway. All we can use is the data we have. The CDF is just a convenient approximation to reality, in which the 80 is an arbitrary location, not necessarily relevant to the actual data.
Four is the frequency of 60-70
Hello Sir, Suppose the following is given:
class freq
—– —-
60-70 4
70-80 6
80-90 7
90-100 3
Now I know that the median here is in the class 70-80, and I also know that the median would be the 10th value. In this case, would the frequency of the previous class interval still be considered – which is 4? (even though we know that the median value is the last value in the second class interval – 70-80)!
I mean, can I consider the frequency of 6 instead?
Please advise.
Thank you,
Vijay Gupta
My general answer to questions that ask, “Can I do this instead?” is, “Try it and find out!”
As I read this, the intervals are probably meant as continuous, the first one being 60 ≤ x < 70; if so, then 80 is actually the first value in the class starting with 80, not the last in the class before that. But you may be meaning something different.
There are 10 values below 80 and 10 values 80 or greater, so I would call the median 80, just by inspection. (With 20 values, I would take the median to be the 10.5th value, that is, the average of the 10th and 11th, not the 10th; since we don’t have access to the individual values, we can’t do that.)
Since 80 is “on the edge” between two classes, it could make sense to take either class as the “median class” in the formula.
If we take 70-80 as the median class, the formula gives 70 + [(20/2 – 4)/6]*10 = 80.
If we take 80-90 as the median class, the formula gives 80 + [(20/2 – 10)/7]*10 = 80.
So it doesn’t seem to make a difference. And if you look at my discussion of the derivation of the formula, you can see why.
Thank you Sir, it is much clear now. Most grateful.
thankyou sir.
Pingback: Cumulative Distribution Functions (Ogive) – The Math Doctors
What happens when the median classes begin from zero and the median class when ranked falls at zero. Do you assume zero is the median. (Variable is number of trainings attended)
I’m not sure exactly what you mean by “the median class when ranked falls at zero”. But suppose that the median class is from 0 to 2, say, so that its midpoint is 1, and that its frequency is 16 (out of 30 in the dataset). Then the class boundaries are -1/2 to 2 1/2, so that L = -1/2, N = 30, F = 0, f = 16, and C = 3. The formula gives m = L + [ (N/2 – F) / f ] * C = -1/2 + [ (30/2 – 0) / 16 ] * 3 = 2.3125 (that is, 2 5/16). This is, of course, only an estimate of the true median, based on the assumption that these 16 people have values evenly distributed from -1/2 through 2 1/2. Since the values are actually 0, 1, and 2, the actual median could in principle be 0, 1, or 2, depending on the distribution.
Note that if the first class is the median class, then f has to be at least N/2 so that this one class will contain at least half the data. You would definitely prefer to use the raw data and find out how many actually are zero, because the classes are far too wide. If more than half of your people attended no training sessions, then the median is indeed zero.
Note that if the first class is the median class, then f has to be at least N/2 so that this one class will contain at least half the data !!!
In this case, which is the median class. While taking the first class as median class, then F and f are issues.
You are quoting my response to the last comment. In this case the distribution is very far from either a normal or a uniform distribution, so there is no basis for supposing that the data are uniformly distributed across the median class, which is the basis for the formula. The estimated mean is therefore even less to be trusted than in more typical cases.
But in this case, F = 0, and f as usual is the frequency of this first class. I showed this in that same response.
How would you define a class boundary if the question says: below 10, below 20…. instead of 10-20,20-30…with frequency x1,x2….and so on.
I would guess that “below 10” and “below 20” mean 0 ≤ x < 10 and 10 ≤ x < 20, since the class width appears to be 10, so that they are to be taken as "from the end of the previous class, up to but not including 10". Sometimes a class would be defined in words as "0 and above, below 10", and they are just omitting the first part as redundant in context. Of course, if this were found in a place other than a grouped frequency distribution, it would mean something different. I would also look earlier in the source for an indication of how they are naming classes, as the first usage of this notation would often have been explained, or else an example might be given that clarifies it.
What if the Median Classes are two. I mean central values lie in 2 different classes. For example
Age Students Cumulative Frequency
5 – 10 10 10
10 – 15 10 20
15 – 20 05 25
20 – 25 10 35
25 – 30 10 45
30 – 35 05 50
Now median is 25th and 26th value that lie in two classes.
An interesting question!
In this case, exactly half the data (25) lie in the first three classes, and half (25) in the last three, so I would expect the median to be on the boundary between those two middle classes, namely at 20.
Let’s try the formula, first taking the 20-25 class as the “median class”: m = L + [ (N/2 – F) / f ]C = 20 + [ (50/2 – 25) / 10 ]5 = 20. Good.
Now let’s try the formula again, taking the 15-20 class as the “median class”: m = L + [ (N/2 – F) / f ]C = 15 + [ (50/2 – 20) / 5 ]5 = 20 again!
I’d say the formula works fine, and you can take either of the two median classes as “the” median class.
Sir I’m a bit confused
How do you get to know the lower class boundary of a median class if given a table and asked to calculate?
Could there be any formula for it because I find it difficult locating the Lower class boundary. My teacher said you divide the frequency by 2 and you know where it falls.
You find the median class by dividing the total number of data points (total frequency) by 2, and locating the class within which the cumulative frequency reaches that value. For example, in the 2016 example in the post, the total frequency is n=22, so we look for the cumulative frequency of 11. Since the first two classes total 9, we reach 11 in the third class, 80-90. Therefore, the lower class boundary is 80.
How can we find median of the following data
I frequency
20-25 8
25-28 12
28-30 14
31-40 16
40-45 20
45-50 25
51-60 15
Your table is inconsistent in how classes are named. Sometimes the first number for a class is the same as the last number for the previous class (as we do for continuous data), for example the first and second both have 25 as a boundary; while other times, such as the last two classses, a number is skipped, so that one class starts at a number 1 more than the previous one (as we do for discrete data). So you will have to correct that before trying to find a median.
Also, the class widths vary considerably; for the mode this would be a problem, but it doesn’t affect the use of the median formula.
I suggest you fix the table and try applying the formula to it, as shown in this post. If you have trouble, use Ask a Question to show us your problem and your work, and we can discuss it in ways not appropriate for a comment.
Thank you so much for the entire discussion. It helped a lot.
After dividing the total number of the frequency by 2, how then can you get your median class?
See my answer to Edidiong Peter on October 24.
Let’s look closer at the “specific example” in the post. The individual frequencies are 4, 5, 6, 7, which total n=22; so n/2 = 11. We want to find a value such that the total frequency below that value is 11, so we start adding up: The first class has 4; the second class adds 5 to that, making a total of 9. The third class adds another 6, making a total of 15, which is more than the 11 we seek. So some number in the third class is greater than 11 other values, making the third class the median class.
To formalize this, you can add a third column, “cumulative frequency”, which will contain the sums 4, 9, 15, 22. The median class is the first one that takes the cumulative frequency above n/2. This third column is shown in the question from Hassan Alvi on October 21, which shows a case in which the cumulative frequency reaches exactly n/2.
Hello prof, how can I find the median for even interval data?
age frequency
—- ————
0-10 40
10-20 53
20-30 58
30-40 64
40-50 72
50-60 49
60-70 36
70-80 25
I did the calculated and I got 52.453125 but not sure if it right.
Hi, Hadeel.
No, that is not even in the median class.
For help with this problem, please go to our Ask a Question page and show us your work, so we can see what went wrong and discuss it.
Can you give me academic reference for formula of median in the beginning so that I can use this information in my project please?
I don’t think I’ve ever seen the formula in an academic text personally, though I am sure it can be found in many, and I have seen it on many websites without much explanation; I first saw it in the question I start with here!
It just occurred to me to look in my 1970 copy of CRC Standard Mathematical Tables (18th edition), and it is found there (p. 555), along with the formula for mode that I discuss elsewhere; but there is no detailed explanation, much less a derivation.
I have long wanted to find a higher-level explanation of both formulas in a proper source that would clearly state the conditions under which they apply (especially the mode). If anyone can provide such formal sources, please comment!
But why do we find the N/2th observation? How will it be the 50th percentile then? Why not find the (N+1)/2th observation as it is done in the case of an individual series?
Reread my answer to Pramod (2016), who used the (N+1)/2 (simulated) data value as you want to do. With my correction to how he was distributing data values across the class, I showed that we get the same answer as the formula containing N/2. My conclusion was that his work, based on modeling the grouped data with evenly spaced data points, was just another (but harder) way to get the same result as the formula that I derived from a piecewise-linear continuous CDF.
Again, the definition of the median for a continuous distribution is the value such that the cumulative probability is 1/2; we just multiplied N by that. In the formula, we aren’t “finding the N/2th observation”; we are measuring 1/2 on a continuous scale from 0 to N. Pramod used the (N+1)/2th observation, and got the same result. So the two approaches are not in conflict, but equivalent.
I have to think about this more, but I suspect that what happens here may be related to the “continuity correction” (subtracting 1/2) that we use when we apply the normal distribution to estimate a binomial CDF.
Hello, how can i find the lower class boundary of the median class?
Hi, Nuruddeen.
Please see my answer to Abdulmalik on November 9, 2020, and the previous answers I referred to there.
How do i find the median for the following data set
class frequency
47-49 6
50-52 6
53-55 5
56-58 5
another issue is, how do i calculate L, F and C
Hi, Pontso.
For help with this problem, please go to our Ask a Question page and show us your work, so we can see where you need help and discuss it.
In particular, I’ll want to see why you are having trouble deciding which is the median class, which determines what L and F in the formula are. (For L, you’ll want to notice that you have discrete data, and need to find the lower boundary, rather than use the lower limit that is given.)
Med=149.5+(2.5/14)5=150.393.
This is the response I have worked when asked to obtain median for the data given.Is there any mistake when I consider the median as being in the 25.5th position rather than 25th position as I have done??
Ht (cm). Freq
140-144. 8
145-149. 15
150-154. 14
155-159. 11
160-164. 2
Clearly you did not follow the formula discussed in this post, as the numerator is supposed to be N/2 – F = 50/2 – 23 = 2, not 2.5.
Why do you think you should use (N+1)/2 instead of N/2? Were you taught it, or were you thinking as Pramod did in this post, and doing what felt right to you? I demonstrated that his formula was wrong, under my assumptions; but I understand why one might think it was right.
Of course, the formula is not exact, providing only a reasonable guess as to the actual median of data that are not available to us; so we can’t really talk about it being “correct” in the first place. But I showed the conditions under which it would be “exact” — though at the end I pointed out that those conditions do not really hold for a discrete distribution, which is what yours is, in contrast to Pramod’s.
Hi sir, I am very confused in the median formula .. please help me by providing your gmail address …
That is not needed. This site provides a better way to ask for individual help. Please go to our Ask a Question page and show us your attempt at a specific problem, so we can see what kind of help you need.
Sir what should be the correct way of finding median class?
OR
In short shouldn’t we use (n+1)/2th variable to find the median class?
Hi, Ayush.
This has been touched on several times in this post and comments.
I’m not sure what you mean by “variable”; if you mean “data value”, it’s worth keeping in mind that we don’t know any specific values in this sort of problem. We can, however, tell which class the middle value will be in, which I assume is what you mean.
Now, there are two different ideas here that are easily confused. To prepare to use the formula, we find the median class (which contains the (N+1)/2th number); the formula itself contains N/2, which is not part of finding the median class. Pramod tried to use (N+1)/2 to derive a formula; I corrected his work, and also used a different approach, to get the formula containing N/2. We are talking here only about the former, right?
Anyway, the quick answer to your question is, yes, you should use (N+1)/2 to find the median class, but don’t always need to. The examples here have been incomplete, because N has always been even.
Consider Vijay Gupta’s question from November 9, 2019 above:
Here N=20; looking at my answer to him, you may notice I mentioned (N+1)/2 = 10.5, but pointed out that I didn’t need to. All it means is that the first 10 data values are less than (or equal to) the median, which is clear just from N/2 = 10. (In effect, I’m rounding down the easy way.) So we know the median will be between the highest value in 70-80, and the lowest value in 80-90. Either class might contain the actual median; and I demonstrated that you get the same estimate for the median whichever one you think of as being the median class.
(Note that I slightly misspoke in that answer; 80 is not necessarily an actual value in either class, just either the largest possible value in one, or the smallest possible value in the other. It is a dividing line, not a data value. But the median is somewhere near that line.)
I demonstrated the same fact for Hassan Alvi on October 21, 2020. In my answers to Edidiong Peter on October 24, 2020, and to Abdulmalik on November 9, 2020, I used N/2 in the same way.
We need an example with odd N, to see how things work then. I’ll just change the example above:
Now N = 19, and since this is odd, we know that (N+1)/2 = 10 gives the actual index of the median. This means that the median is the 10th value, which is the highest value in the class 70-80; so that is the median class. If I used N/2 here, it would be harder, so I don’t! In the example with an even N, I just divided by 2 knowing that would give the index just below the median.
So, thanks for the question, which provides an opportunity to add this insight: We do need to use (N+1)/2 for odd N, though we can get by without it for even N. Just do whichever division comes out even, and think about its meaning!