
(A new question of the week)
This week we have a short discussion of a question that takes a basic concept one step further: How do you graph an equation on the plane, that contains only one variable? It’s a simple question when applied to linear equations, but takes on new dimensions when we generalize it.
Equations with only one variable
Here is the question, from early October:
I have two questions.
1) I have seen that graph of any single variable first order equation is a straight line. It is said that graph of x + 3 = 0 is a line parallel to y axis. But there is no mention of y. Does that mean irrespective of value of y, x = 3 which implies straight line parallel to y axis?
Or, it implies a point on line y = x + 3 when y = 0?
Or, drawing graph of any single variable equation in Cartesian plane is not possible.
Which interpretation is correct?
2) In the above context is it possible to draw graph of any quadratic equation i.e., second order single variable equation. Plz help.
Debkanta has made a small algebraic error (\(x+3=0\) is equivalent to \(x=-3\), not \(x=3\)), but that doesn’t affect the main question: What does it mean when one variable doesn’t appear in the equation at all? And the second question takes it to a new level.
Linear equations
Doctor Fenton was first to answer:
Hi Debkanta,
Thanks for writing to the Math Doctors.
The first interpretation is correct if x + 3 = 0 is the entire equation you want to graph. The graph of the equation x + 3 = 0 is a straight line parallel to the y-axis (but this line is x = -3, not 3). Since y doesn’t occur in the equation, for every value of y, the point (-3,y) is on the graph, since the coordinates of this point satisfy the equation for any value of y.
When an equation doesn’t mention y, that means that y is not constrained by the equation; it can take any value. To put it another way, as long as we have the right value for x, the equation doesn’t care what value we give to y. So the points \((-3,0)\), \((-3,-5)\), \((-3,2000)\), and so on are all part of the graph of the equation.
As Debkanta said, regardless of the value of \(y\), any point with \(x=-3\) is on the graph.
In fact, we can rewrite the equation so that y is present: \(1x+{\color{Red}0}y+3=0\), which fits the general form for any linear equation in two variables, \(ax+by+c=0\). But the coefficient 0 means that changing y has no effect on the truth of the equation; so once we have a point on the graph, every point directly above or below that point must also be on the graph. That’s what makes a vertical line.
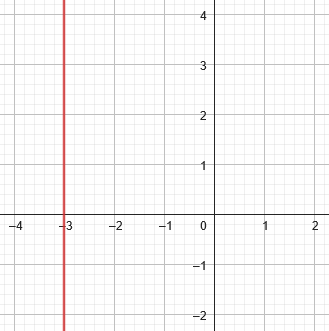
Here is the graph of \(x+3=0\) as an equation in one variable:
![]()
In that context, there is no second variable to think about, and everything is as it should be..
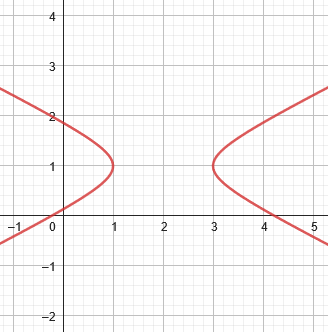
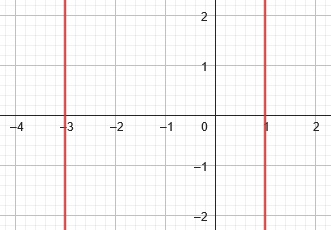
Here is the graph of the same equation as an equation in two variables, which is Debkanta’s question:
The second suggestion (replacing 0 with y in the equation) was wrong:
If you want to graph the equation y = x + 3, then when y = 0, x must satisfy 0 = x + 3, so the point (-3,0) will be on the graph, but that will be the only point on the graph with x = -3. The point (-3,y) will not be on the graph for any value of y other than y=0.
So this is a different equation with the same x-intercept, but otherwise unrelated.
Here is the graph of \(y=x+3\), showing that the point \((-3,0)\) is on the graph, but other points with \(x=-3\) are not on this graph:
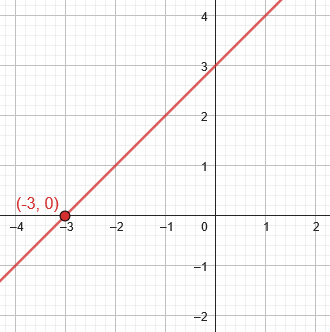
No other point on this graph satisfies the equation \(x+3=0\).
Quadratic equations
As to the second question (about quadratic equations in one variable), we can first consider the general equation of which this will be a special case:
The general quadratic equation in two variables has the form
ax2 + bxy + cy2 + dx + ey + f = 0 ,
where at least one of the coefficients a, b, or c is not 0. There may be no solutions, such as for the equation x2 + y2 = -1, so the graph is empty, or the equation may have only a single solution such as x2 + y2 = 0, giving a graph which is a single point, (0,0). The graph can also be a pair of lines, such as when a = c = d = e = f = 0 and b ≠ 0, so that bxy = 0, giving x = 0 or y = 0, so that both the x-axis and y-axis are part of the graph.
Otherwise, the graph is a conic section: a circle; ellipse; parabola; or hyperbola.
See Wikipedia.
These various possibilities were discussed in Degenerate Conics I: Mystery of the Missing Case. Here, for example, are the graphs of \(x^2+y^2=-1\) (invisible!), \(x^2+y^2=0\) (a single point), \(x^2+y^2=1\) (a circle), and \(xy=0\) (a pair of lines) respectively.
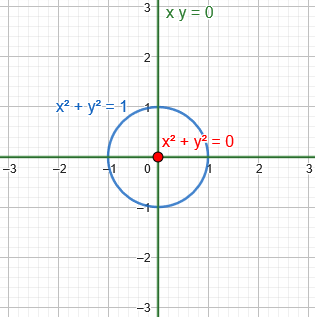
All but the circle are “degenerate conics”, which fit the general equation though they don’t have the shape we expect for a full-fledged conic section.
As we’ll see in more detail below, the case with only one variable is just another degenerate conic.
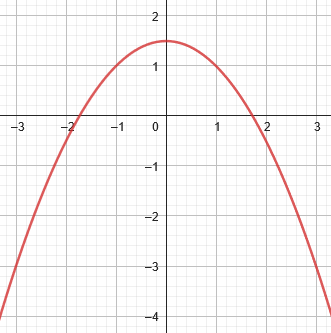
Here are some more typical quadratic equations for comparison, which have both variables, showing both their general form and a specific form:
$$x^2+2y-3=0\\y=\frac{3}{2}-\frac{1}{2}x^2\\\text{Parabola}$$
$$x^2-4y^2-4x+8y=1\\(x-2)^2-4(y-1)^2=1\\\text{Hyperbola}$$
$$11x^2+24xy+4y^2-68x-56y+101=0\\(3x-4y-2)^2-4(4x+3y-11)^2=25\\\text{Rotated Hyperbola}$$
(That xy term makes it interesting!)
$$x^2-4y^2-4x+8y=0\\(x+2y-4)(x-2y)=0\\\text{Intersecting lines}$$
This last one is another of the degenerate forms; notice how it is related to the first hyperbola.
What the missing variable does
Doctor Rick provided a slightly different perspective on each question:
Hi, Debkanta. Doctor Fenton answered your questions, but I’d like to emphasize how his answer applies, particularly to your second question. You said, first:
1) I have seen that graph of any single variable first order equation is a straight line. It is said that graph of x + 3 = 0 is a line parallel to y axis. But there is no mention of y. Does that mean irrespective of value of y, x = 3 which implies straight line parallel to y axis.
The answer was yes.
If we are thinking in the context of equations in two variables, but an equation is missing a variable, then the missing variable has no constraints; it can take on any value. The equation gives us the allowed value of the other variable, and together they define a straight line. Thus, x + 3 = 0 tells us that x must be -3, but y can have any value. The locus of points with x coordinate -3 and any y coordinate is a vertical line.
A locus is the set of all points that fit some description; that’s what graphs typically show, and is a good way to think about them. Does a point make the equation true? Then it will be part of the graph.
Either variable might be missing. If an equation has only y, with x missing, then the value of y is fixed, but x can take any value, resulting in a horizontal line. Here is \(y+3=0\):
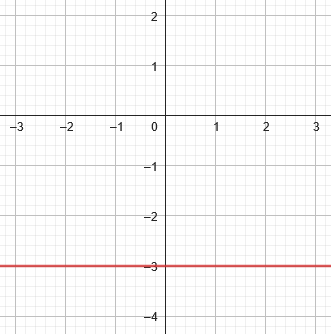
We tend to think of y as the second of two (or more) variables; but it is entirely possible to have a context in which y is the only variable, in which case the graph would just be
![]()
again! (Algebra doesn’t care what name a variable has.)
Quadratic equations in one or two dimensions
Then you asked:
2) in the above context is it possible to draw graph of any quadratic equation i.e., second order single variable equation.
You’re asking about equations like x2 + 2x – 3 = 0, right? This equation has two solutions, x = -3 and x = 1. This is usually all we’re looking for. But if we are considering this equation in the context of equations in two variables, then we’d do the same sort of thing I just described for linear equations. There is no constraint on y, but x is constrained to the two values -3 and 1. Thus the graph of the equation consists of two vertical lines, x = -3 and x = 1.
Commonly, such an equation is considered in a context where x is the only variable under consideration, and we just solve for the value(s) of x. In this example, we factor and find that \((x-1)(x+3)=0\), so that \(x=1\) or \(x=-3\). These are simply real numbers, which can be placed on a number line:
![]()
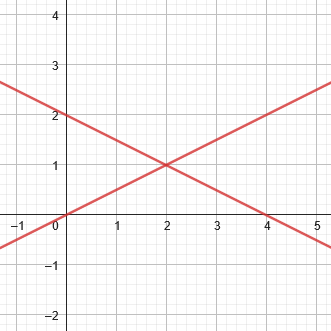
Here is the graph of \(x^2+2x-3=0\) as an equation in two variables, graphed on a plane:
Two lines are one of the degenerate conic sections, as Doctor Fenton had mentioned.
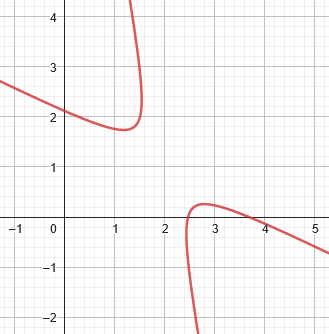
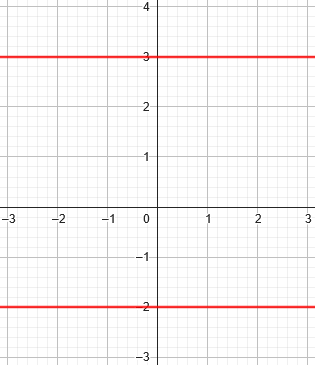
We could also, again, have a quadratic equation containing only y, which will typically result in a pair of horizontal lines. Here is the graph of \(y^2-y-6=0\):
None of this is what you normally think of as the graph of a quadratic equation! That’s why I find this question interesting, even though in a sense it is all trivial – but not to the thoughtful student.
Does it make any sense to do this?
Would we ever want to think of a quadratic equation in one variable in this way? Yes, we might. Look at what Doctor Fenton said: the general quadratic equation in two variables has the form
ax2 + bxy + cy2 + dx + ey + f = 0 ,
where at least one of the coefficients a, b, or c is not 0. Suppose we choose b = c = e = 0; then the equation above reduces to
ax2 + dx + f = 0 ,
which is your basic quadratic equation in one variable. So this could indeed happen when you’re working with general quadratic equations in two variables. As I said, its graph will be two vertical lines. (It might be one vertical line, if the quadratic has a double root, or no solution, as Doctor Fenton also noted.)
So equations like this might arise in situations where both variables are in use, but one doesn’t happen to be present in one particular equation.
Here is the graph of \(x^2+2x+1=0\), which provides only one value for x:
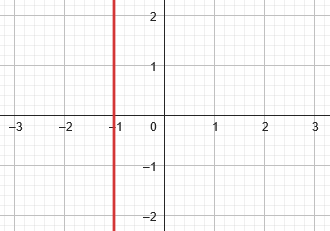
That equation can be factored as \((x+1)^2=1\), with solution \(x=-1\).
And here is the graph of \(x^2+2x+3=0\):
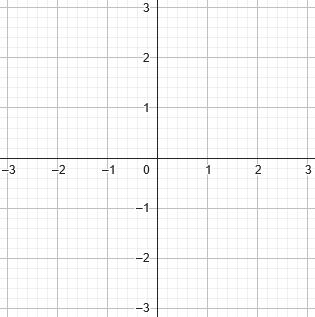
(That equation has no real solutions!)
Debkanta replied:
Thanks Dr. Fenton and Dr. Rick, I have no doubt now and I have explained the concept to my son also. He is also quite satisfied. In fact I always allow my son to ask many questions and I also ask questions that come in my mind. In one such discussion above confusion came in my mind. Thanks again for your reply.
I closed:
That’s good to hear — both that you both understand, and that you are helping your son the way we would!
Feel free to ask us more like this, and even to encourage your son to communicate with us directly.
Three dimensions: missing one or two variables
Let’s take it one more step, and think about equations with one or two variables graphed in three dimensions.
Consider that equation \(x^2+2y-3=0\), which we saw above as a parabola; it has only two variables, but if we treat it as an equation in three variables, then the third variable, z, is unconstrained, resulting in a parabolic cylinder:
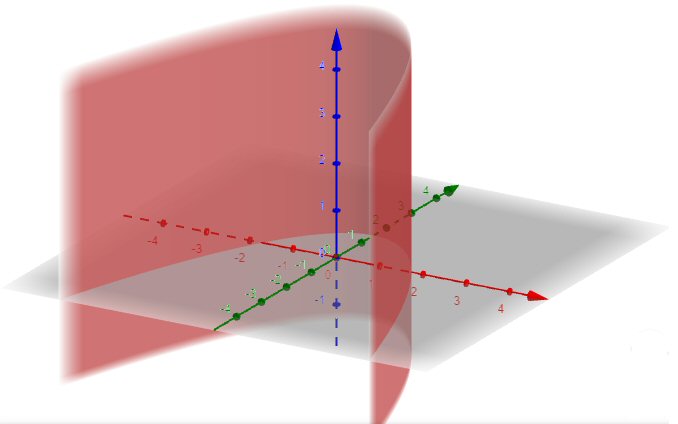
In the xy-plane (red and green axes), we see the parabola we had before, with a vertical line passing through each of its points because z can take any value.
And the equation \(x^2+2x-3=0\), with only one variable, does not constrain either y or z, so we get a plane at each of the two values of x that satisfy the equation:
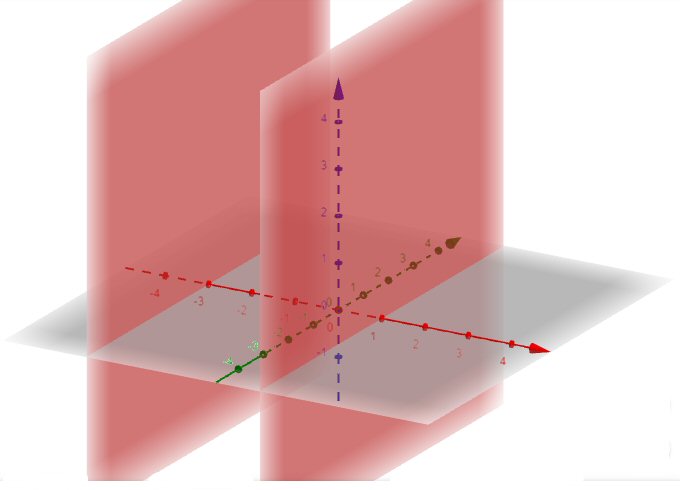
Here we have all points in space with \(x=1\) or \(x=-3\).
This is just an extension of Debkanta’s idea, and it illustrates the power of missing variables!