
(A new question of the week)
This week’s question, asked in January on the new site, will take us through some tricky areas of calculus, and also give a glimpse both of the value of quoting the entire problem you are working on when you ask for help, and of the interesting side discussions we can get into when that rule is violated! Several of us got involved in this discussion.
The question
Kurisada, who has had a lot of interesting questions in a variety of fields, asked this:
I was asked to find the area of y = 5x^4 – x^5 with the range of x: 0 – 5.
And I found the answer: 3125/6.
Then I was asked to find the area of the same function with the range of x: 0 – 6.
But the answer is 0.
While when the range of x: 0 – 7, the answer is not 0.
May I know why the answer can be 0?
Doesn’t it must be >= 3125/6?
How can the area of a larger region be smaller? And how can an area in fact be zero?
Signed areas
Doctor Fenton answered:
Hi Kurisada,
Remember that when using integrals to compute the area between a curve and the x-axis, all area below the x-axis will be computed as a negative number. When the area above the x-axis is numerically equal to the area below the x-axis, the total area will be 0 because the two areas have opposite signs.
Note the subtle restatement of the problem: Doctor Fenton assumes that rather than “find the area of the equation” (which is not mathematically meaningful), it must have been “find the area between the curve and the x-axis”, which is the typical form of such a question. Also, in such a question, areas below the axis are taken as negative, because that is what integration inherently does. A definite integral in effect adds areas of little rectangles, each a width (Δx) times a height (y). If y is negative, that area is negative.
And this is how you can get a total area of zero, when the positive and negative areas cancel one another out.
But more was needed. Kurisada wrote back, asking about a different, similar problem:
Hi Doctor.
I am still not understand the mechanism.
I saw another function: y = (1/x^3) – 8 and I found two of the areas, that are from interval 1/4 to 1/2 and 1/2 to 1. I got 4 and -2.5.
And when I try to find the total, I got 6.5 (it is 4 + 2.5).
In this question, may I use the same way? Or maybe my way above is wrong? (I checked the key answer and my answer is true.)
Checking this example, we find these regions above and below the axis:
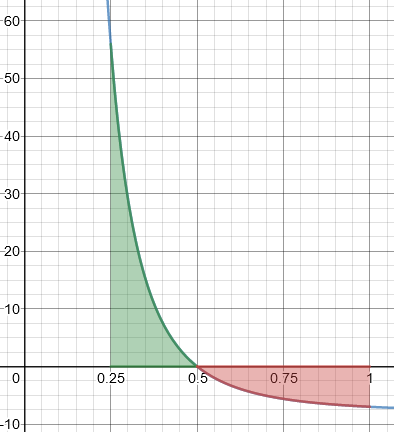
The integrals (signed areas) are 4 and -2.5; in this problem, they are evidently not asking for the total signed area, but for the total absolute area (counting both regions as positive).
So now we have two different kinds of questions being asked about similar functions.
Variations in wording
As Doctor Fenton didn’t respond quickly, I jumped in with some thoughts about wording:
Hi, Kurisada.
It may be a difference in how the question is phrased. Please quote exactly how your problem was worded. Different authors may also mean slightly different things.
According to some, the area UNDER a curve is found by merely integrating, and takes sign into account, so that the answer of 0 is appropriate for your area from 0 to 6. Some authors might ask for the area of the region BETWEEN (or BOUNDED BY) the curve and the x-axis, intending an UNSIGNED area, so that you would add the absolute values of the separate areas found by integration, as in your second example.
Here is an example of a site that seems to be inconsistent about this, giving a negative answer to one problem, but taking absolute values for another:
https://revisionmaths.com/advanced-level-maths-revision/pure-maths/calculus/area-under-curve
Some use various ways to explicitly indicate what they want, such as “net area” here:
http://www.mathwords.com/a/area_under_a_curve.htm
I would check how your own book states these problems, and see if they tell you how to distinguish the two types of question.
The first of these, in its first example, asks, “What is the area between the curve \(y = x^2 – 4\) and the x axis?”. After giving the answer -10.67, they add, “Note: the area is negative because it is below the x-axis. Areas above the x-axis, on the other hand, give positive results.”
In their second example, they ask, “Find the total area between the curve \(y = x^3\) and the x-axis between x = -3 and x = 2.” This time, they add absolute values, getting the answer 8. Presumably the word “total” is the cue to the difference.
The second page uses the term “net area” for the signed area, which turns out to be zero, and doesn’t give an example of “total area”.
So both wording, and the usage of a particular author, can make a huge difference.
Kurisada replied:
Hi Doctor
Does it mean that, if the area is not bounded by anything, the area we interpret is only when the function is positive (And we subtract it with the negative one)?
And the reason we subtract it is because we need to find the net positive area?
I was thinking if there is no bound, the area should be infinite.
My book only explained about the area between the curve(s) (and x or y axis).
The question shows the curve and the shaded area (that is between the curve and x axis).
Then it first ask me to find the area from x = 0 to x = 4.
Then the question ask me to evaluate if the range is from x = 0 to x = 6.
I’m not sure what was meant by “not bounded by anything”; obviously an “area” without a boundary is infinite. My guess is that there is some language ambiguity about the use of “bounded” in these problems.
Areas between or under curves
Doctor Fenton picked up the question again, discussing the topic in general:
The general description of the problem is to find the area between two curves over a bounded interval. Usually, these are two graphs of the form y=f(x) and y=g(x) over the interval [a,b] (with a < b), or graphs of the form x=h(y) and x=k(y) for y in the interval [c,d].
When the graphs are y=f(x) and y=g(x), then one curve will be above the other over some interval. If f(x) > g(x) over [a,b], then the area bounded by the two curves will be
b
∫ f(x)-g(x) dx .
aThis will be a positive number, since f(x) > g(x) on the interval. However, if the two graphs intersect, then they may change places as to which is the upper curve and which is the lower curve. If f(x)≥g(x) for a ≤ x ≤ c but f(x)g(x) over c ≤ x ≤ b, then y=f(x) is the upper curve on [a,c], and the lower curve on [c,b]. In this case, the total area is
b c b
∫| f(x)-g(x)| dx = ∫ f(x)-g(x) dx + ∫ g(x)-f(x) dx .
a a cTo find total area, you always subtract the lower curve from the upper curve when integrating.
If you just integrate the difference f(x)-g(x), you are getting the net area, since the integral will be negative on intervals where g(x) is the upper curve.
If you are given only one function on an interval, then you need to remember that the x-axis is a curve, namely y=0 (so g(x)=0 on the interval).
This might make more intuitive sense if you think of the position/velocity interpretation of the integral: if t is time and f(t) is the velocity at time t, where the particle is moving to the right when f(t) > 0 and to the left when f(t)<0, then
b
∫ f(t) dt
agives you the final position at time b if the particle started at time a. If the integral is positive, it finishes to the right of where it started; if the integral is negative, it finishes to the left of the starting position; and if the integral is 0, it finishes where it started. You don’t have to keep track of where the motion is to the right or left – the integral does that automatically, because the integral is positive on intervals where the integrand is positive, and negative on the intervals where the integrand is negative.
If you want the total distance traveled, however, you need to compute
b
∫ |f(t)| dt .
aThen you need to determine where the particle changes direction and compute integrals over the intervals where it is always moving in the same direction separately. That is, you compute
d
∫ f(t) dt
con intervals [c,d] where f(t) ≥ 0, but compute
d
∫- f(t) dt
con intervals [c,d] where f(t) ≤ 0. Then you add the separate results.
Does this help?
Examining the graph
Kurisada replied:
I understand about Doctor’s explanation.
But I still don’t get about the area = 0 (especially after seeing the graph).
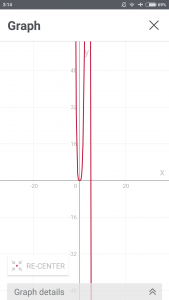
The graph is as attached below:
If I need to find the area from x = 0 to x = 6, which area should I search (in the graph above)?
Can Doctor please mark the area? (I began to realise that what makes me didn’t get it is the lack of understanding in the graph).
I’ve held off on showing the graph of the function until now, because this will be important here. Doctor Rick jumped in at this point:
Hi, Kurisada.
Here is a graph of y = 5x4 – x5, the first function you talked about. Is that what your graph shows? It’s hard to be sure, because you chose scales for the axes that don’t show it very clearly.
On my graph you can see one region above the x axis, between x = 0 and x = 5, and another region below the x axis, between x = 5 and x = 6. The areas of these two regions are equal; you can’t see this exactly from the graph, but you can see that it is reasonable. The integral of the function from 0 to 6 equals 0 because the integral from 0 to 5 is that area, while the integral from 5 to 6 is the negative of that area.
If you still have questions about this particular problem, we’ll need further information. Doctor Peterson asked you for the exact wording, and from what you’ve said, evidently it included a figure. Could you show us that figure? We can’t be sure what it meant by “the area”, especially for the second part, without seeing the figure. (We still might not be sure, but at least this should help.)
Although graphs are not required to solve problems like this, an accurate graph can be very helpful (and an inaccurate graph can be very misleading).
The real problem
Finally, Kurisada answered the request for the exact problem:
Here is the question:
The curve now makes sense to me after Doctor sent it (I use phone app and I cannot change the scale) (and the straight line confused me).
So does it mean that if I found the total area, it will be 7776 + 7776 = 15552?
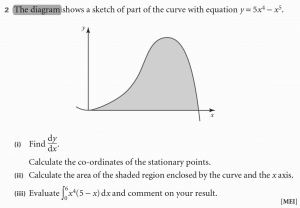
The graph is not precise, and doesn’t attempt to cover up to x = 6; but the wording is the important thing to observe. Doctor Rick wrote back:
Showing us the actual problem changes a lot! You were never asked to “find the area of y = 5x^4 – x^5 with the range of x: 0 – 5 … [and then] to find the area of the same function with the range of x: 0 – 6″ as you said at first.
Rather, you were asked first to calculate “the area of the shaded region enclosed by the curve and the x axis” — which is quite clear, given the figure. It would be meaningless to “find the area of y = 5x^4 – x^5”; we can only find the area of a region, not of a function.
Since the region shown is above the x axis and below the graph of the function, it is found simply as the integral from 0 to 5. However, I do not get 7776 for this integral, as your last message implies. I get 3125/6 = 520 5/6, as you imply at the end of your first message.
Part (iii) of the problem does not mention area at all; therefore we don’t need to get into the variations among textbooks that Doctor Peterson mentioned. It only asks you to carry out the integral from 0 to 6, and “comment on your result.” You found the result of that integral to be zero; and we have discussed how that can be.
Using the correct values for the integral from 0 to 5 (3125/6) and for the integral from 5 to 6 (-3125/6), the correct result for the total area of the two regions in my figure is the sum of the absolute values of those integrals: 3125/6 + 3125/6 = 3125/3 = 1041 2/3.
Kurisada closed out the discussion:
I’m really sorry Doctors!
I’ve always been thinking that it means the area.
But now I understand if I was asked to find the area.
Thank you very much Doctor Rick, Doctor Fenton, and Doctor Peterson for the explanations!
As I said at the start, the discussion demonstrates the value of showing the exact wording of a problem from the start; but on the other hand, not doing so led us into a deeper view of what is going on.