
Last week we looked at several basic word problems for which the Fibonacci sequence is part of the solution. Now we’ll look at two problems that take longer to explain: a variation on the rabbit story, and an amazing reverse puzzle.
Breeding mice
The first is from 1997:
Multiplying Mice

Marco's Uncle Oscar gave him two mice, which he named Whiskers and Oscar. But Marco discovered that he made a big mistake. Oscar should have been named Oscarella - she just had 8 babies, 4 males and 4 females! "Ten mice aren't so many," said Marco to his mother. "They're cute."

"Yes," said his mother, "but these cute baby mice can breed when they are 6 weeks old. The babies are born after 3 weeks. If each mother mouse has only one litter and all the litters have 8 babies, half males and half females, how many mice will you have 18 weeks from today?"

What answer should Marco give to his mother?
Those aren’t the Fibonacci rabbits; there’s a lot more going on here. But might it still be solved with the same sort of thinking?
A Fibonacci-like recursion … or not?
Doctor Rob answered briefly, perhaps assuming the problem would be assigned to a student experienced with such problems:
This is a nice twist on the old problem of Fibonacci about breeding rabbits.

The number of mice at any time in the future is the same as the number of mice three weeks earlier (survivors) plus four times the number of mice nine weeks earlier (breeders).  This leads to the following recursion:

   x[n] = x[n-3] + 4*x[n-9].

The initial conditions are that x[-6] = 2, x[-3] = 2, and x[0] = 10.  You want x[18].  Apply the recursion six times, with n = 3, 6, 9, 12, 15, and 18.

Hint:  The answer has three digits.
There is a problem here, which will become more apparent as we continue: Doctor Rob has evidently misread the problem, which is not really a Fibonacci-type problem. Before we continue, let me deal with the real problem as given, and then we can let Doctor Rob have fun with the far more interesting problem he sees.
The problem is that it says, “If each mother mouse has only one litter …”. This implies, as I read it, that we don’t have, as in the rabbit problem, every living mouse continuing to have babies. Instead, we have one female producing 4 females (and 4 males) that, 9 weeks after their birth, each produce 4 more females (and 4 males), and so on. Each generation is simply 4 times the one before, so “today” we have 8 babies, and in 9 weeks we have \(8\times 4=32\), and in another 9 weeks (for a total of 18), we have \(32\times 4=128\). But nothing is said about the mice dying; so the total number is the total of all these generations: \(2+8+32+128=170\). That three-digit number is the answer to the problem as I interpret it.
Here is what this looks like “now” and at 9 weeks:
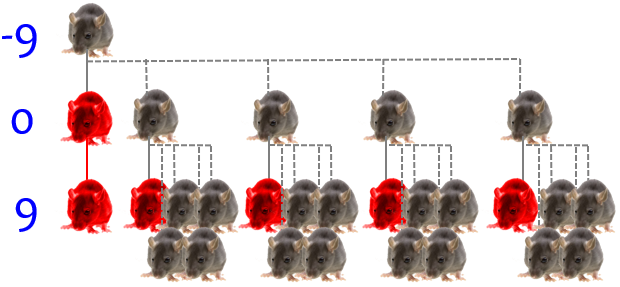
(I’ve shown only the females, so these numbers, 1, 5, 21, are doubled for the actual numbers. Red mice are no longer breeding.)
But let’s let the mothers keep breeding (more like real mice) and see what happens!
The anonymous “patient” replied,
Can you please simplify the answer?

Thank you!
One of the difficulties of helping students who only state a problem without showing any work or giving any background, is that we can’t sure what math they know, so we can easily under- or over-estimate their abilities.
Making a table
To which Doctor Rob answered,
I'm sorry that you didn't understand the answer I gave.  I didn't just give the answer because we show people how to solve a problem without doing it for them. You will learn more from doing it yourself with some direction from us than if we just tell you the answer.

Make a list of times starting with 6 weeks ago.  Next to it, make a list of the number of mice that existed at that time.

    Time           Number of Mice
    ====           ==============
    6 weeks ago          2
    3 weeks ago          2
    Today               10
    3 weeks from now    18 = 10 + 4*2
    6 weeks from now    26 = 18 + 4*2
    9 weeks from now    66 = 26 + 4*10

The number of mice in any line in the above table is the number in the line above it (mice that survive from one line to the next), plus the number of new babies.
It’s interesting that he starts with negative times! It makes sense, because the story started in the middle of the action, with the birth of a new generation; if we are going to let the mother continue giving birth, it is most natural to start with her birth.
My understanding is that Doctor Rob is assuming that the mother breeds again immediately after giving birth, so that 3 weeks after one birth of 8, while that generation is still maturing, another 8 are born.
Here is a picture of the first few generations:
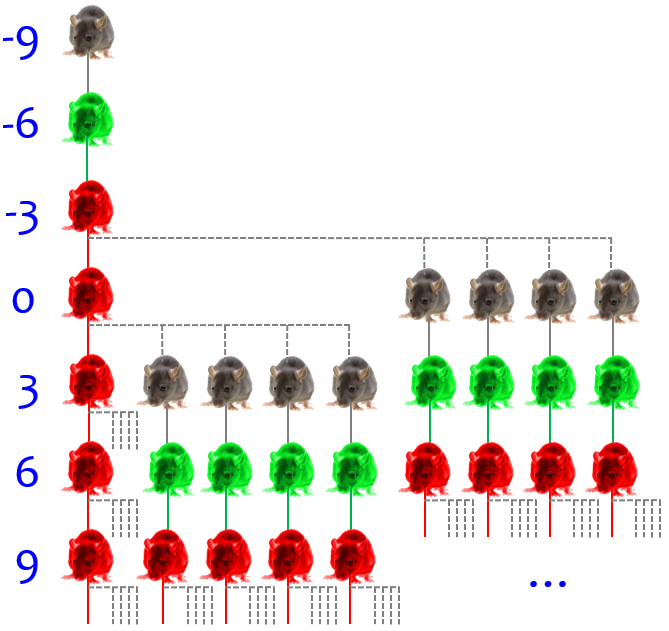
Again I’m showing only the females for simplicity, and omitted many newborns, so the numbers shown or implied (1, 1, 1, 5, 9, 13, …) have to be doubled to get the total number. Natural color is a newborn, green is immature (not yet breeding), and red is mature and breeding, so that it has babies in the next line. Rows are 3 weeks apart; row 0 is “now”, so the last line (partially shown) is 9 weeks from now. We need to go another three lines to week 18.
The number of new babies is four times the number of parents who are producing offspring. Since it takes parents 9 weeks from birth to produce new offspring, the number of fertile parents is the number of mice 9 weeks earlier, which appears three lines above.

To calculate the number in the next line, add 66 (from the line above) to 4 times 18 (from the 3rd line above). Repeat this operation until you have the answer for 18 weeks from now.

Is that better?
The facts of life
The “patient” responded,
Yes, but I still don't understand about breeding and litters. Can parents that have already made children make children again? How long do the babies wait to make more babies?

I came up with a answer of 506, but it's probably wrong. Can you explain the problem and how to figure it out?

Thanks!
Now Doctor Rob could help more:
I think we have isolated the problem. You are not familiar with the terms used in stating the problem.

For a pair of mice to breed is to begin the process of having babies. Another word that is used is that the mice mate with each other.

A litter of baby mice is the set of babies that are born together at the same time to one mother.  The same word is used for puppies and kittens.

Yes, parents who have had children can have children again in 3 weeks.

Babies have to be 6 weeks old to breed, and 9 weeks old before their babies can be born.

Your answer of 506 is correct.
Here he states his understanding that mice continue having litters after the first one, which I think was denied in the problem, though I could be wrong. (That’s where I would ask the teacher!)
The idea is to figure out how many new babies are born at each 3-week interval. Then you add them to the number of mice that existed 3 weeks earlier to get the new number of mice. The number born is 8 for each pair of parents, or 8/2 = 4 times the number of parents. The number of parents is the number of mice born at least 9 weeks ago, since it takes 9 weeks from birth before mice can give birth to their own babies.

Putting this together, the number of new babies is 4 times the number of mice born at least 9 weeks earlier. Add this to the number of mice 3 weeks earlier and you will get the new number of mice.
This is the source of the recursion he stated, $$x_n = x_{n-3} + 4x_{n-9}$$
I personally would simplify things a little by taking the index as the number of 3-week intervals; by his definition, our sequence consists only of \(x_{-9}, x_{-6}, x_{-3}, x_0, x_3, x_6, \dots\).
This suggests building the table above, with each line representing the situation at a particular time. Since all the activity takes place in multiples of three weeks, the first column of times in the table are spaced three weeks apart. Then the first three rows in the second column can be filled in from the statement of the problem, with Whiskers and Oscarella and their first litter of babies (2, 2, and 2 + 8 = 10).

For the rest of the rows in column 2, use the rule figured out in the previous paragraph to calculate the number.
Let’s complete the table using the recursion:
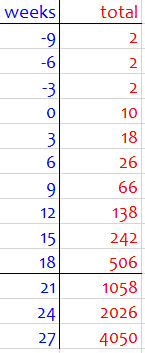
(I started from the Whiskers’ and Oscarella’s birth, so I started with 2, 2, 2, and then the recursion took over. I also went beyond the official ending point at 18 weeks, out of curiosity.)
We could also make a table listing each maturity level (newborn, immature = 3 weeks, and mature = 6 weeks), with each column coming from the previous row of the previous column, adding to the existing total of mature mice, and newborns coming from existing mature mice:
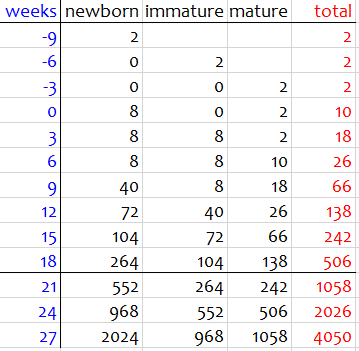
We could do more, such as finding an explicit formula, or seeing why it seems to settle down to approximately doubling; but I’ll leave it here.
Fibonacci in reverse
The other problem for today, from 2002, raised the bar considerably, even though it is still at the elementary level:
Price of Pencils

The price of pencils has skyrocketed in recent years. Each year for the last 7 years the price has increased, and the new price is the sum of the prices for the two previous years. Last year a pencil cost 60 cents. How much does a pencil cost today? How much did a pencil cost 7 years ago?

I am trying to help my daughter on this math problem but am having no luck. Can you help? My daughter is 11 years old and in 6th grade.
The Fibonacci recursion is explicitly stated this time; but we need two specific values to build up a complete sequence, and we are only given one, namely last year’s price.
I answered, allowing myself to give a complete answer in part because I was teaching the father, who could then teach the daughter in our preferred interactive style, and also because I suspected my method would not be appropriate for the child anyway:
Hi, George.

This is an interesting problem! At first I thought there couldn't be enough information, but then I realized that the fact that the price increased every year was the key.

The problem involves a Fibonacci sequence, working backward; the most orderly way I can see to do it is to use simple algebra. The main idea is that, since in each year the price is the sum of the prices of the two previous years, the increase in price is always the price the year before. For example, if the price started at 5, and the previous year it was 2, then the next year it will be 5+2=7, and the following year it will be 7+5=12. Working backward, each year's price is the difference between the next two years: 12-7=5.
So if we knew the two most recent terms were, say, 5 and 7, we could work backwards: 7, 5, 2, -3, and there are only two years in which the price has increased. If this year it is, say, 100 and last year it was 60 as stated, then the year before was \(100-60=40\), and the previous year was \(60-40=20\), and the year before that \(40-20=20\), so it didn’t increase between those years. The sequence would be 20, 20, 40, 60, 100, again with an increase only the last three years. We could use trial and error like this; but that’s what algebra is good at replacing.
Working backward with inequalities
Let's work backward, starting with the unknown price this year, which we'll call x. Last year it was 60, so the previous year it must have been x-60 (so that the sum of x-60 and 60 gives the next price, x). Continuing this process backwards gives us a sequence of expressions:

    x
    60
    x-60
    120-x
    2x-180
    300-3x
    5x-480
    780-8x
    13x-1260

I've continued this to the eighth year back, since that price is the increase from the seventh year.
That is, 7 years ago the price was \(780-8x\), and it increased by \(13x-1260\) the next year.
Now we use the key: all of these increases must be positive. That gives us a sequence of inequalities, each of which can be solved to find a range for x:

    x > 0
    60 > 0
    x-60 > 0        x > 60
    120-x > 0                   x < 120
    2x-180 > 0      x > 90
    300-3x > 0                  x < 100
    5x-480 > 0      x > 96
    780-8x > 0                  x < 97.5
    13x-1260 > 0    x > 96.92
The second column contains inequalities for x that say what it is greater than, and the third column contains “less than” inequalities.
Notice that alternate inequalities give lower and upper bounds on what x can be, getting tighter and tighter; by the end, we see that

    96.92 < x < 97.5

and the only whole number value x can have is 97. Now, plugging this into the expressions for the prices (or just working backward numerically by subtracting, which is easier), we get

    x        = 97
    60       = 60
    x-60     = 37
    120-x    = 23
    2x-180   = 14
    300-3x   = 9
    5x-480   = 5
    780-8x   = 4
    13x-1260 = 1

Seven years ago, the price was 4 cents, and it has increased every year since, following the indicated pattern.
Interestingly, my random choice of 100 above was not far off; but we couldn’t tell, because a small change can have a big effect! But this final step was the same as the check I did there for practice. (You may also notice that we could have been told it’s been increasing over the last 8 years.)
Doing it by trial and error
Of course, if you just have an answer, you can check it by working forward and seeing if the results are correct. And I suspect that the method an 11-year-old is expected to use is more like trial and error: try setting the original price at 1, 2, 3, 4 and trying various small increments for the next year until you find one that works. Basically, this is just a long addition problem.
Since, as I pointed out, a small change in our guess (for this year’s price) results in large changes in the results (7 years ago), this is not the sort of trial and error where we can make one guess and jump right to the final answer. We don’t know ahead of time how much to change our guesses. All we can do is try things and learn.
That would be part of the reason I reversed my suggestion, and said to start with the price 7 years ago and see what we get for last year’s price, hoping for 60 cents. The hard part of doing it that way, however, is that we have to start with a pair of numbers (first two years) rather than a single number (this year). I doubt that I tried any actual trial and error at the time, so I gave it a try now (ignoring what I know about the answer!). Rather than do all the arithmetic myself, I used Excel, putting one guess at a time in the top two rows and making new guesses based on the results at the bottom.
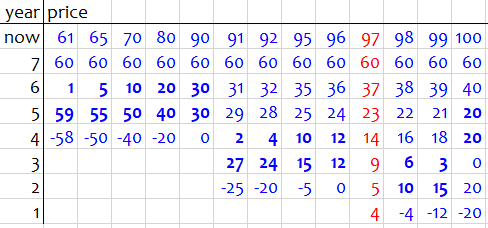
First, here is what I found for the method I recommended, working forward:
I started with the smallest possible first two prices, 1 and 2, and saw that the year 7 price was too low, 21. Not knowing how fast to change numbers, I just increased the second price 1 cent at a time and watched the year 7 price increase – interestingly, it increased by 8 each time. (Maybe there’s a pattern there worth exploring …) Once that passed 60 (61, bold), I went back and increased the year 1 price to 2, repeating the search pattern by increasing the year 2 price by 1; again the year 7 price increased by 8, so I might have made a bold leap and guessed that it would continue 34, 42, 50, 58, 66, and again overshoot the goal. I would have just checked that last case (2, 7) to confirm my hunch. But that wouldn’t save a lot of work, and would cost me some uncertainty – so even doing it by hand, I might have continued just as I did.
Then I moved the first price up to 3, and even more quickly passed 60; and when I made it 4, my first try worked (red).
But now we have the usual difficulty with trial and error methods: Can we be sure there isn’t another solution, so the correct answer would be, “We can’t know for sure”? I’d be more sure if I continued and tried (5, 6).
This approach might actually be appropriate for an even younger student, as it gives plenty of practice with small additions, which isn’t too important for sixth grade; but the problem-solving aspect might need the greater experience she has.
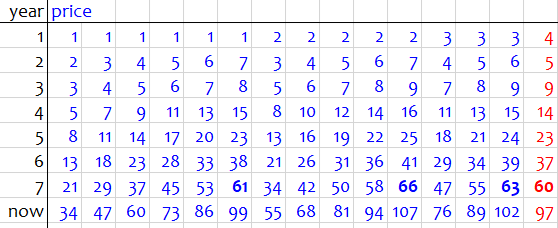
Now, how about starting as I did with the present price, working backward over 7 years? Here is my work with that method:
Here I started with the smallest possible price for this year, 61. (It couldn’t decrease this year, because then the price in year 6 would have been negative.) I saw that there would be a decrease in price (bold) as recently as year 6, so I’m nowhere near the solution. Rather than increase 1 by 1, I took a little leap to 65 and found there wasn’t much change, so I leaped to 70, 80, 90 and saw the week 5 amount decrease steadily until there was no change from week 5 to 6. With that, I decided to be more careful, increasing only by 1; that brought a dramatic change already, but after that there wasn’t much change, so I made a small jump to 95, saw what I expected, and crept slowly upward until I reached the goal at 97. But the change there was so dramatic, I wondered if 98 might also be a solution; it wasn’t. Just to make sure, I continued for a couple more steps and saw it get worse and worse. It looks like 97 is the only answer, so I can say with (near) confidence that this year’s price will be 97 cents. (And that is, of course, what we found more quickly and definitively by algebra.)
So the problem is entirely solvable by trial and error, and even in more than one way. But algebra was much more satisfying!