
Having looked at all the usual transformations of a function and its graph, there are two more situations I want to look at. The first of these are the horizontal and vertical transformations introduced by absolute values (with a bonus thrown in: square roots); then next time we’ll conclude this series with a look at the special needs of trigonometric functions.
Absolute value on the outside: fold
First, we have a question about the case \(\left|f(x)\right|\), from 2002:
Graphing Absolute Values

I'm currently enrolled in pre-calculus algebra, and I am stuck on the following problem:

  The graph of a function f with domain [-3,3]
  is shown in the figure. Sketch the graph of
  the given equation.

Basically, what I have is a grid, with the given function's graph.  I am asked to sketch graphs of various equations such as y=f(x-2), y=f(x)-2, etc.  I can do this with no problem.

However, when I try to sketch the graph for the following |f(x)|, I don't know how to graphically represent it.  I need to give you a bit more information about the problem.

The following points are plotted on the graph:

  (3,0), (2,0), (1,1), (2,0), (3,-1), and (4,0).

Given that information, I'm fairly sure that the range is (-1,2).

Is there any way I can find the answer by creating an overall equation for the base graph f(x) given the graphical information that I do have, such as the plotted points, domain, and range?  In other words, given this information, can I reproduce or create what this absolute value graph should look like?

I have tried several methods to create the graph, and I know that I have missed or overlooked a key step somewhere. Currently my base graph, if it were to be combined with the graph for y=|f(x)|, has a big X dissecting it at the origin.  I have tried graphing this on my calculator as well, and I just don't understand how to shift, reflect, stretch, shrink or do whatever I'm supposed to do to this particular problem based on the shape of the base graph.  I have searched my text thoroughly for similar questions, and I have not had much luck.  Could you please suggest to me how I could go about solving this problem?
In my answer, I will be ignoring the details of Loralei’s given graph, because she has made some mistake in describing it; as described it consists only of five points (two of the points given are identical) with no lines joining them. It is not a function, because two of the points lie on the same vertical line; its domain is not [-3, 3] but {1, 2, 3, 4}; and its range is not (-1, 2) but {-1, 0, 1}. I left the specific graph for a later question if she needed more help, and focused on the bigger issues that would allow her to work on the problem herself.
I started by reviewing the basics of shift transformations, which she said she could handle, as a starting point for this one:
Presumably you understand the ideas behind graphing y=f(x-2) and y=f(x)-2 given the graph of y=f(x). The first shifts the graph to the right, because x has to be 2 units larger before f(x-2) is what f(x) was. The second shifts the graph two units down, because you take the value of y and subtract 2 from it. This page illustrates these ideas, in case you are not quite sure:

  http://mathforum.org/library/drmath/view/54509.html

The graph of |f(x)| is more like the second of those: you find the value of f(x), as shown on the graph you are given, and then take the absolute value of y. Think about what the absolute value does to a number. If it is positive, it leaves the number unchanged; |4| is just 4. So wherever f(x) is positive, the graph of |f(x)| is the same!
The transformation she is asking about is an “outside” transformation, which acts on the output of the given function and therefore changes y (a vertical transformation).
Any part of the given graph that is above the x-axis will be left unchanged.
But the absolute value of a negative number is its opposite; |-4| is 4, which you can think of as -(-4). So wherever f(x) is negative, you can think of |f(x)| as -f(x). What does that look like? For a given value of x, if y is negative, you replace y with -y, making it positive. Your point (3,-1) on the original graph will become (3,1) on the new graph. This is like reflecting the graph in the x axis.
Any part of the graph that is below the x-axis is reflected above the axis.
In fact, you can imagine the absolute value as "folding" the graph along the x axis, so that the top half stays in place, while the bottom half is folded up onto the top half plane. (Imagine it being on transparent paper.)

      y=f(x)                 y=|f(x)|
    |         /\           |\        /\     __
    |        /  \          | \___   /  \   /
    |       /    \         |     \ /    \ /
    +------/------\----    +------+------+----
    |  ___/        \       |
    | /             \__    |
    |/                     |
       <0     >0    <0
      flip | keep |flip
As we have talked about shifting, stretching, and reflecting a graph, this transformation can be thought of as folding: flipping only the bottom half upward.
Now I had to deal with Loralei’s expectation that she could write an equation for whatever function she was given.
You don't want to find the equation for the graph you are shown, because that could be absolutely anything; there is no way to determine for certain the function represented by a given graph, and it would probably be very complicated. (Take mine above, for instance!) And knowing the equation wouldn't help you at all. The whole point of what you are learning is to make it easier for you to graph a function, by understanding how various transformations affect a graph. This way, you can build a complicated function out of simple ones, and see what it looks like without having to plot points. And if you used a calculator to do the graphing, you wouldn't be gaining any knowledge of how functions work, which can help in solving problems. Your "short cut", as often happens, would turn out to be the hard way to the goal.
I expected to pursue the problem further, but she showed in her response that she needed only what I had given her. The next step would have been to demonstrate the process of graphing the transformed function by simply applying the appropriate transformations to each point of the given graph.
Square root of a function: erase and warp
Another question later the same month asked about the same absolute value transformation, and another that is harder (while still being an “outside” transformation):
Graphing the Absolute Value/Square Root of a Function

Can you illustrate and discuss how taking the absolute value or the square root of a function affects the graph of the function?
The absolute value part was just a repeat of what I said above:
Think about what the absolute value does to a number. If the number is positive, its absolute value is the number itself: the absolute value function does not change it. If the number is negative, its absolute value is the negative of the number (which is positive): the absolute value function reflects the number in the origin, sending it to the point the same distance away but on the opposite side.

So what happens if you take the absolute value of a function? Wherever the function is positive (or zero), the graph stays right where it was. Wherever the function is negative, the graph is reflected up over the x-axis, so that its y coordinate is positive rather than negative:

    |      ___              |      ___
    |   __/   \             +   __/   \   /
    |  /       \            |\ /       \ /
    +-+---------+--  ---->  +-+---------+--
    |/           \          |
    +             \         |
    |                       |
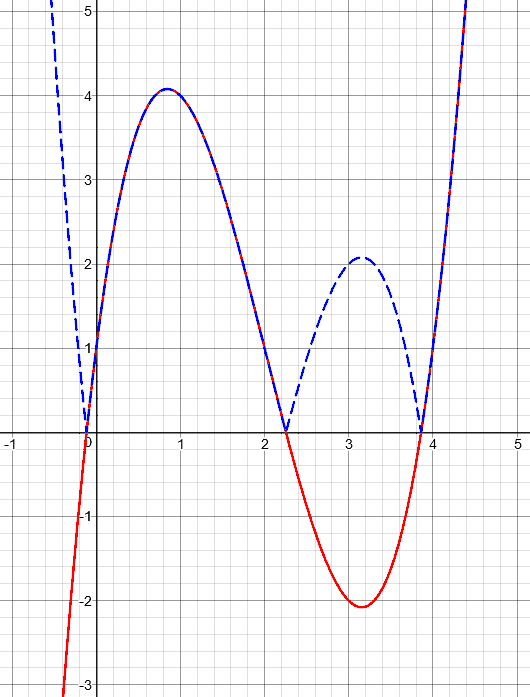
Here is a random function (in red) and the result of applying the absolute value, \(y = \left|f(x)\right|\) (in blue):
The square root is quite different, but like the absolute value, it discriminates between positive and negative values:
Now how about the square root? In this case, if f(x) is negative, its square root does not exist (since we are talking about real functions). You can just erase that part of the graph! If f(x) is positive, the square root will squash it or stretch it vertically, depending on its value. Look at the graph of y=sqrt(x), compared with the graph of y=x. You will see that if x<1, sqrt(x) is larger, while when x>1, sqrt(x) is smaller. So when f(x)<1, sqrt(f(x)) will be above f(x), and when f(x)>1, sqrt(f(x)) will be below f(x):

    |      ___              |      ___
   1+   __/   \            1+   __/   \
    |  /       \            |  /       \
    +-+---------+--  ---->  +-+---------+--
    |/           \          |
    +             \         |
    |                       |

I can't get enough detail in my graph to show the stretching. But you can put a dot on the graph where f(x)=1, so the graph of the square root will go through that point; then you can warp the given graph upward where it is below y=1 and downward where it is above y=1. The peaks and valleys of the new graph will lie at the same x coordinates as in the original graph, but will be at different heights.
Let’s look at that with better technology. First, to visualize my comment about the square root increasing numbers less than 1, but decreasing numbers greater than 1, here is the graph of the square root that I mentioned, \(y = \sqrt{x}\), compared to the function \(y = x\):
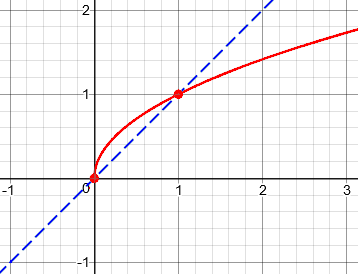
When x is less than 0, there is no y; when x is between 0 and 1, y is greater than x; when x is greater than 1, y is less than x. This is what the absolute value will do to y when we apply it to a function. (In fact, what we are doing here is taking the square root of the blue graph, to make the red one!)
Now, take our random function, and apply the square root to it:
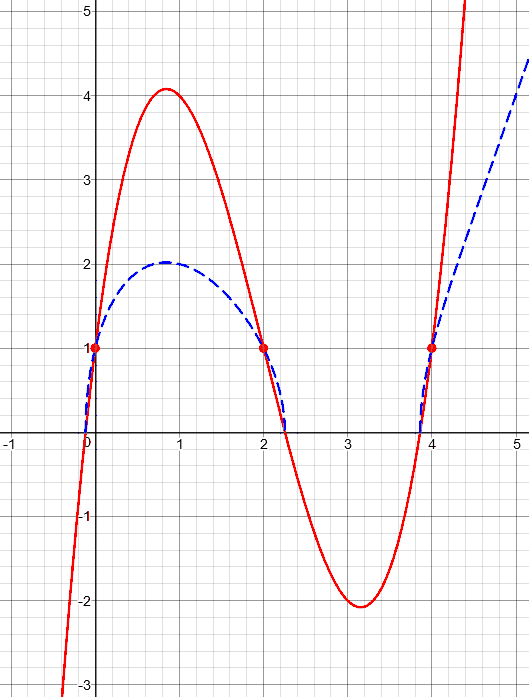
You’ll notice one feature I didn’t mention: Just as the graph of the absolute value approached the x-axis vertically at the origin, our blue graph approaches the x-axis vertically at each place where the original graph crosses the axis, even though the original was slanted there. It is above the red until the marked points where y = 1, and then is below the red. Where y is 4, it becomes 2. I doubt that a teacher would assign this and expect perfection; this question is more a matter of curiosity.
Absolute value on the inside: erase and duplicate
Now we come to the really tricky case (but it’s really easy): \(f\left(\left|x\right|\right)\), from 2013:
ABS(f(x)) and f(ABS(x)) Graphs

A graph of f(x) has a hump up to y = 1 for x between 0 and 2. To the left of the origin, it slowly tails off to negative infinity.

I have to sketch the graphs of the functions
   (a) f(x + 1)
   (b) f(-x)
   (c) abs(f(x))
   (d) f(abs(x))

I am confused as to how I am supposed to plot f(abs(x)): even after I looked up its solution, I am unsure as to how they got that answer.
The first two cases are familiar to us now; I made a rough sketch of the graph Pavan described, and did a shift for the first:
Let's draw your graph like this:

                +1    *
                |  *    *
                |*        *
    +-----+-----*-----+-----*
   -2    -1    *|      1     2
             *  |
    *           +-1

(a) f(x + 1) will be a horizontal shift, 1 unit to the left:

                      *1
                   *  | *
                 *    |   *
    +-----+-----*-----+-----*-----+
   -3    -2    *-1    |     1     2
             *        |
    *                 +-1

To check this, what will f(x + 1) be for x = 0? f(0 + 1) = f(1), which from the given graph is 1. And that's what the shifted graph shows.

For more on this, see the prior Dr. Math conversation

  Graph with f(x)
  http://mathforum.org/library/drmath/view/54509.html
(You may notice my shortcut: I really used the same graph and just moved the axes. We’ll be seeing this idea next time.)
Then I did the reflection:
(b) f(-x) will be a reflection in the y axis, because x is replaced by -x for any point on the graph:

        *     +1
      *    *  |
    *        *|
  *-----+-----*-----+-----+
 -2    -1     |*    1     2
              |  *
              +-1         *

To check this, what will f(-x) be for x = -1? f(-(-1)) = f(1), which from the given graph is 1. And that's what the reflected graph shows.

For more on this, see

  Order of Transformations of a Function
  http://mathforum.org/library/drmath/view/68503.html
The next one was a repeat of what we did above:
(c) |f(x)| will reflect any negative parts of the graph up over the x-axis, making them positive:


  *           +1    *
           *  |  *    *
             *|*        *
  +-----+-----*-----+-----*
 -2    -1     |      1     2
              |
              +-1

To check this, what will |f(x)| be for x = -2? |f(-2)|, which from the given graph is |-1| = 1. And that's what the new graph shows.

For more on this, see

  Graphing Absolute Values
  http://mathforum.org/library/drmath/view/60968.html

  Graphing the Absolute Value/Square Root of a Function
  http://mathforum.org/library/drmath/view/61112.html
Now for the new one:
(d) f(|x|) will ignore values of f for negative x (since the argument of f will never be negative), and replace it with a reflection of the right side:

        *     +1    *
      *    *  |  *    *
    *        *|*        *
  *-----+-----*-----+-----*
 -2    -1     |      1     2
              |
              +-1

To check this, what will f(|x|) be for x = -1? f(|-1|) = f(1), which from the given graph is 1. And that's what the new graph shows.

For more on this, see

  Graphing f(2x) and f(|x|)
  http://mathforum.org/library/drmath/view/64038.html
In the page I referred to, Doctor Marshall said this:
As for f(|x|), for any value x greater than or equal to 0, f(|x|) is just f(x). For negative values of x, the value of f(|x|) is just the corresponding f(-x) (-x being a positive number now). If you draw a picture of this you will see that this absolute value operator effectively takes a function, truncates (i.e., removes) the x<0 portion and replaces it with a reflection of f through the y axis.
For more on the inside absolute value, see this question, which is about making a table of data to graph, rather than going directly to the graph:
Transforming Tables when f(x) Becomes f(abs(x))
The last thing I say there is worth a look:
Now, why does this have a different feel than other horizontal transformations? Because the absolute value is not one-to-one, so that outputs that appeared only once originally have to appear twice now. We can't just replace values of x in the table; we have to duplicate values of y and put them with appropriate values of x.
That is, all the other “inside” transformations did something to x that could be reversed, so that any input given to the function only occurred for one value of x (shifted or stretched or reflected); but the absolute value means that we will get the same point from two different inputs, on the left and the right. The new graph consists of both the right side of the original graph, and a reflection of it over the y-axis.
Let’s take the same function we used above (in red), and graph \(f\left(\left|x\right|\right)\) (in blue):
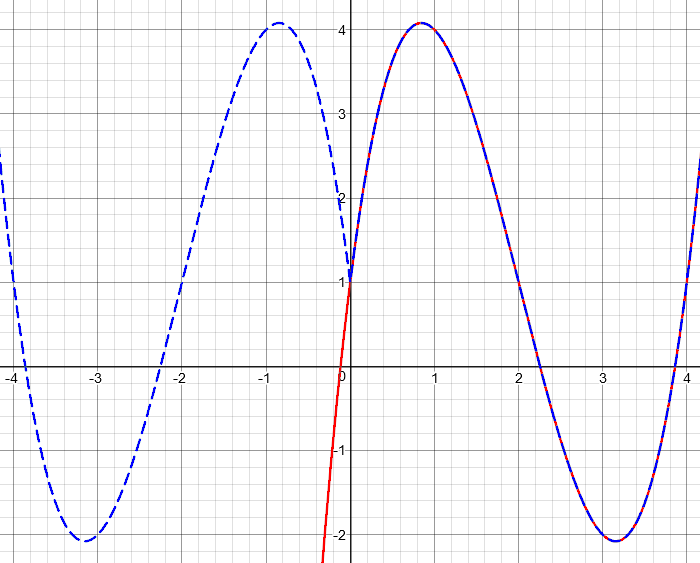
As explained, we ignore what was on the left side, and replace it with a reflected copy of the right.
Hello, I have a question that the meaning of absolute value in mathematics means the distance of that number from zero. it’s true? Well, if true, then answer the ambiguity that has occurred to me 0+ | -5 | = 5 Because the sum identity is 0, then we can write | -5 | = 5 But if we use other numbers instead of 0, like the number 5, something interesting happens 5+ | -5 | = 10 and the distance of the number -5 It shows us the number 5. Here, the number 5 is considered as the center and this model works. Thankful
Hi, Jon.
I’m sorry, but I don’t understand what you are saying; I see no ambiguity, and nothing “interesting” (surprising?) in 5 + |-5| = 10. If you’d like to discuss this, please write to us through the Ask a Question link.