It seems that most of the interesting questions recently have been about relatively advanced topics, though commonly in introductory classes. Here, we’ll help a student think through a problem introducing the idea of a random walk on a graph. (“Graph” here doesn’t mean the graph of an equation, which we study in algebra, but the subject of Graph Theory: an arrangement of nodes and edges, as we have previously discussed in Graph Coloring: Working Through a Proof, and less formally in Frequently Questioned Answers: Three Utilities.) We’ll watch the evolution of a representation of the problem until it becomes easy.
The problem
Here is the problem, from the start of May (I have replaced the low-quality image that was provided with my own drawing):
Please find the question below. Help me in solving it.
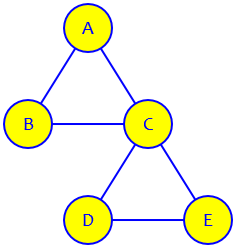
Perform random walk in the undirected graph of Figure 1:
Figure 1
Suppose we start from node A at Step 0. At each step, we move to one of the neighboring nodes with equal probability. Then for each node we have possibly moved to, we continue to move from it to the next node using the same probability rule.
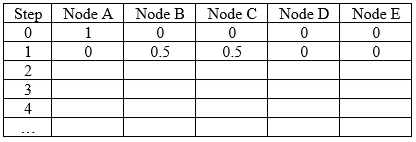
In the first two steps, the probability of walking to each node is shown in Table 1. Please run and obtain the probabilities for Step 2 to 4. Besides filling in the table, you should also write down the computation processes.
Note: Theoretically, the probabilities of walking to certain nodes will converge to a stationary distribution, if the number of steps is large enough. This question aims to provide you with a sense of such convergence.
Table 1
At a higher level, we would be asked to prove this convergence, but that is far beyond the level we are at, so I will stick to the question as asked.
Step 1 is easy, as there are two equally-likely destinations, so each of nodes B and C has probability \(\frac{1}{2}\), and no other node is possible:
But what happens next?
Since Chethan had not shown where he needed help, I started as usual, with a request and a hint for starting:
Hi, Chethan.
Since it says, “This question aims to provide you with a sense of such convergence”, it will be essential for you to work through it yourself to see how it works. They have taken you through the first step; you just need to continue the process.
What I need, in order to help you, is some information about what help you need. You can either show me what you think you need to do for the next step or two so I can see if you understand it, or ask some specific questions to show me where you are unsure.
For each of the nodes you might be at (B and C), find the probability of going to each other possible node, and write in the probability that you will be there at the next step (multiplying and adding as needed). You’re expected to show your thinking, so tell me how you get the numbers. Then we can discuss it.
The central idea here, hinted at in my suggestion, is that the probability of ending up at a given node is the sum of the probabilities of each path to get there; and the probability of getting there by a given path is the product of the probabilities of each choice made along the way. This is somewhat reminiscent of the “Pascal’s triangle” approach to counting paths discussed in How Many Paths from A to B?
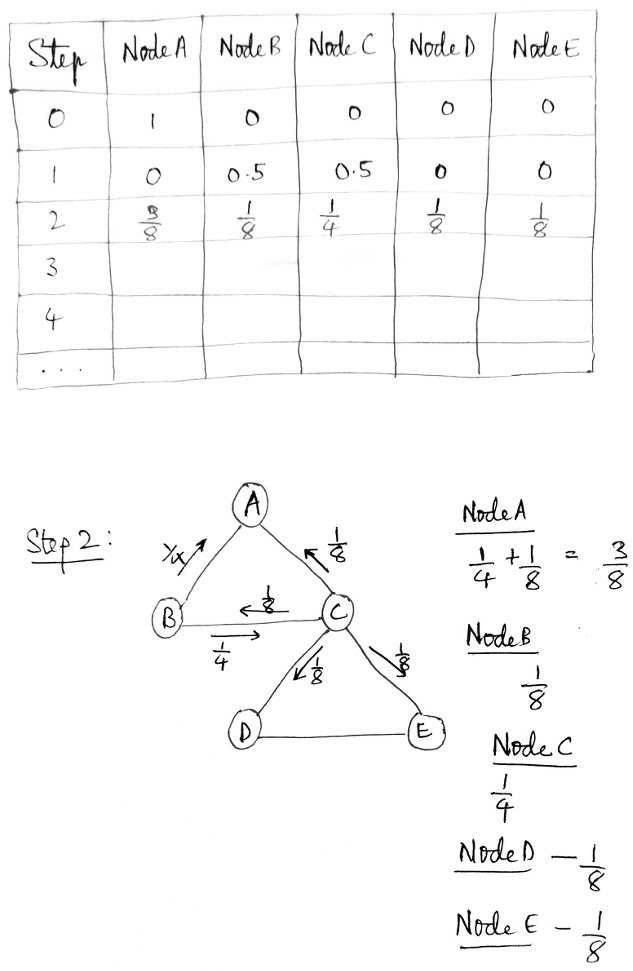
First attempt: step 2 correct
This request yielded the initial work I needed:
I found out Probabilities in Step 2.
I’m not able to do it for Step 3 and Step 4.
Please solve and send the solution if possible.
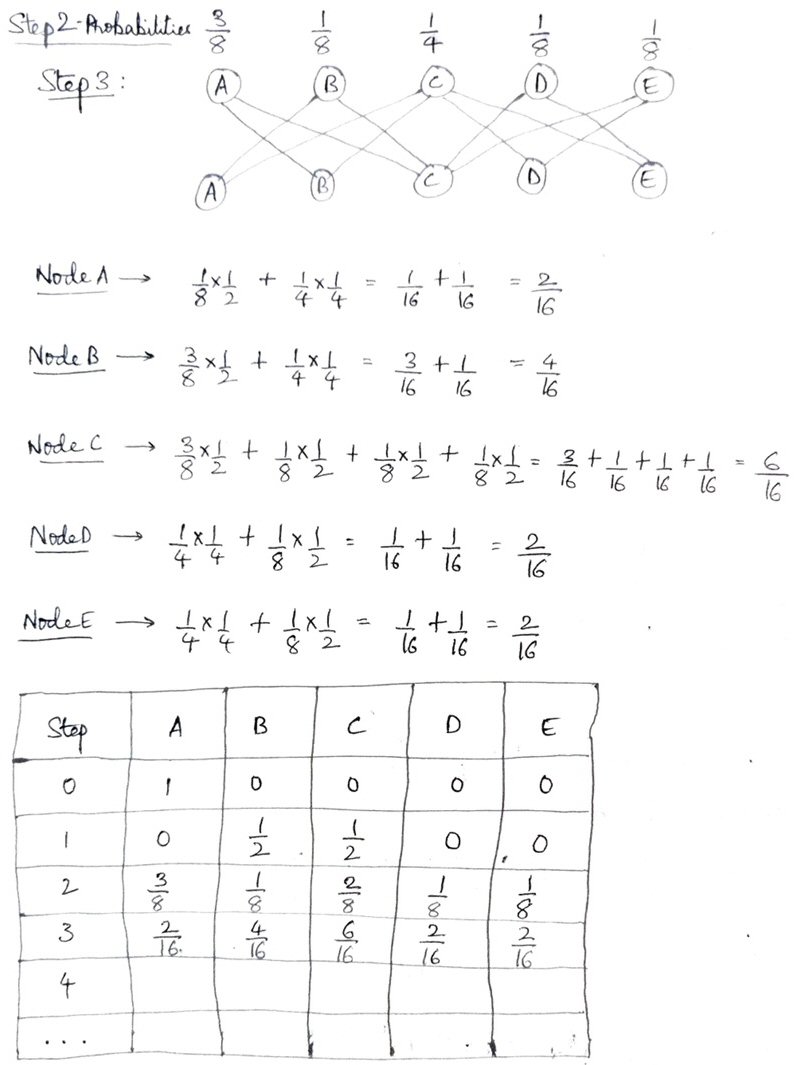
This is correct as far as it goes, though he hasn’t explained all the details. So let’s examine his work.
We started at either B or C, each with probability \(\frac{1}{2}\). From B, he shows two arrows marked with the probability \(\frac{1}{4}\); this is the probability of being at B \((\frac{1}{2})\), times the probability of taking that path from B \((\frac{1}{2})\); similarly, from C, he shows four arrows marked with the probability \(\frac{1}{8}\); this is the probability of being at C, times the probability of taking that path from C \((\frac{1}{4})\). Then he has added the probabilities on the arrows reaching each node, and put those in the table. (As a check, I would add up the row to make sure they total 1, and they do.)
This is just right, and is just what I had suggested. So we’re doing well … except that he was unable to continue.
Unfortunately, the work didn’t show me where Chethan might be going wrong, so it was less useful than an error would have been! (Many students fail to recognize the value of failure, both as a way to learn and as a way to ask for help.)
I replied, quietly rejecting his request for a full solution:
You got step 2 right. I don’t see why you can’t do the next. Please show your attempt, or tell me what went wrong. I want you to be able to work it out yourself.
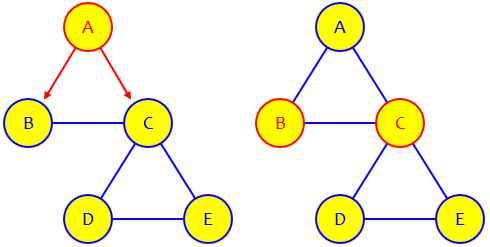
Second attempt: looking for a different representation
Chethan answered,
I’m not able to find Probabilities at Node A and Node B.
Please solve and send the solution if possible.
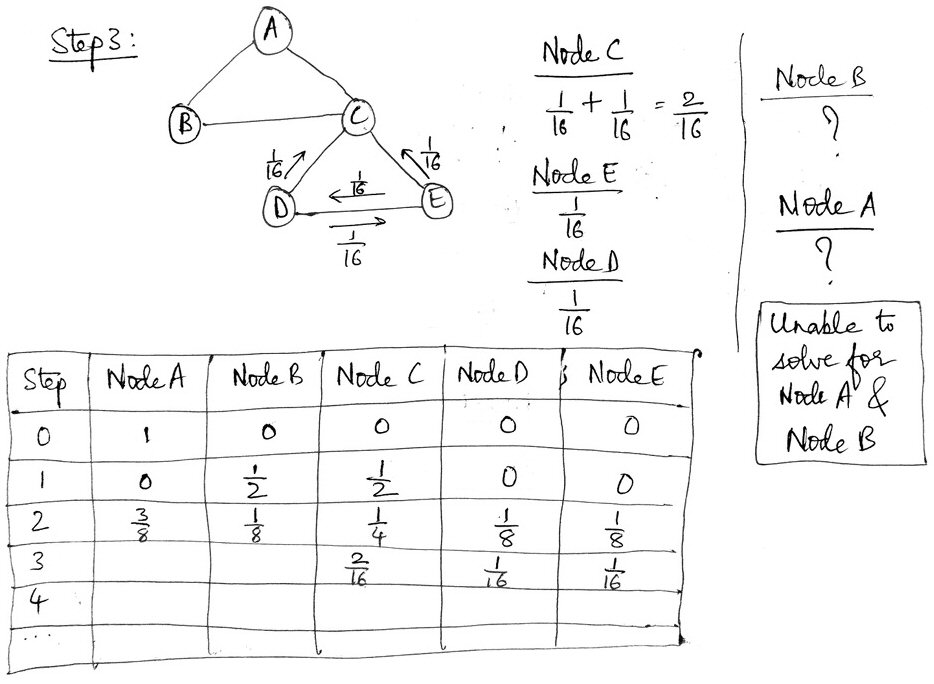
He has correctly shown what happens if we were at D or E, from which we can get only to C, D, or E; he seems not to have tried handling paths from A, B, or C, for no clear reason. I suspect this method, drawing out every possible transition, is just getting a little too complicated! A better method may be needed. I often encourage students to pursue a more or less brute force method at first, if only to gain a feel for how things work while looking for a way to make it easier. Shortcuts are often best seen after you walk past them. (That reminds me of some times when I’m out geocaching in the woods and realize, after bushwhacking to a goal, that there was a deer trail I could have taken instead …)
I suggested some alternative ways to organize the work:
I imagine your difficulty is in finding a way to keep track of different ways to get to each node. I see two ways to do it.
You appear to be working backward, listing all the ways to get to a given node, and adding up the probabilities. I think it can be done this way if you are careful, but you have missed some ways to get to C, D, and E, and apparently didn’t try for A and B. [I now think I was wrong in this guess.]
My first thought was to work forward. I would list each node with its probability from step 2, and then below each I would list the nodes I can get to from it, each with its new probability. Then I would add them up.
What Chethan had not done is simply to start at every possible node, rather than just D and E.
One difficulty in the method he has been using is simply that there will eventually be too many arrows to keep track of. So I suggested a table to replace the graph itself:
For instance, here is how I might have done step 2:
   A   B   C   D   E
   0  1/2 1/2  0   0
A     1/4 1/8        = 3/8
B         1/8        = 1/8
C     1/4            = 1/4
D         1/8        = 1/8
E         1/8        = 1/8
For example, there are four places to get to from C, so the probability for each of those paths is 1/4, and I multiplied 1/2 by 1/4 for each.
This gives the results you got, but in a way that can be applied to any state.
I intentionally only redid step 2, for which we already have the answer, to make the difference clear; this is just a different representation of the same work, with a cell in the table replacing an arrow on the diagram. Now that all nodes have been reached, steps from here on will need all 25 possible arrows (or cells), not just the 6 we had here!
Another disadvantage of even this table is that, because the probabilities are new for each step (taking into account the starting probabilities from the previous step), we are missing an opportunity to reuse work from one step to another. We’ll be fixing that!
There are many ways to organize this, some perhaps less space-consuming than this (but harder to type). There are also ways to do this with matrices, but I am guessing you are not familiar with those.
See what you can do for step 3 now.
The use of matrices is part of the more advanced approach we’re not going to get to.
Third attempt: a new diagram
Chethan again was reluctant to keep showing work:
Sorry, I’m unable to find out the Probabilities in Step 3.
Please help me out with this.
Please send the complete solution so that I can understand and get back to you if I still have any doubts.
I chose to apply some “tough love” and demand an effort:
No, I will not let you bypass learning to think for yourself; I won’t give up on your intelligence. You are not unable; you appear to be unwilling to take the risk of being wrong, which is the only way to learn.
You have shown that you understand the basic ideas by getting step 2 right; and I have shown you a complete solution for step 2, which should be enough to get you moving forward. I know you can do what I suggest, either by copying what I did or by inventing some other way of organizing your thinking. A complete solution of the rest will not help you learn the things this exercise is intended to teach you.
Show some more thinking on step 3, and then we can discuss what you are misunderstanding, if anything.
I’m often a little worried when I do this, but it worked. Now I got what I wanted; in fact, he is now devising a new representation, departing from the form in which the graph was given:
This is all I could do.
If it’s wrong, please send the correct solution.
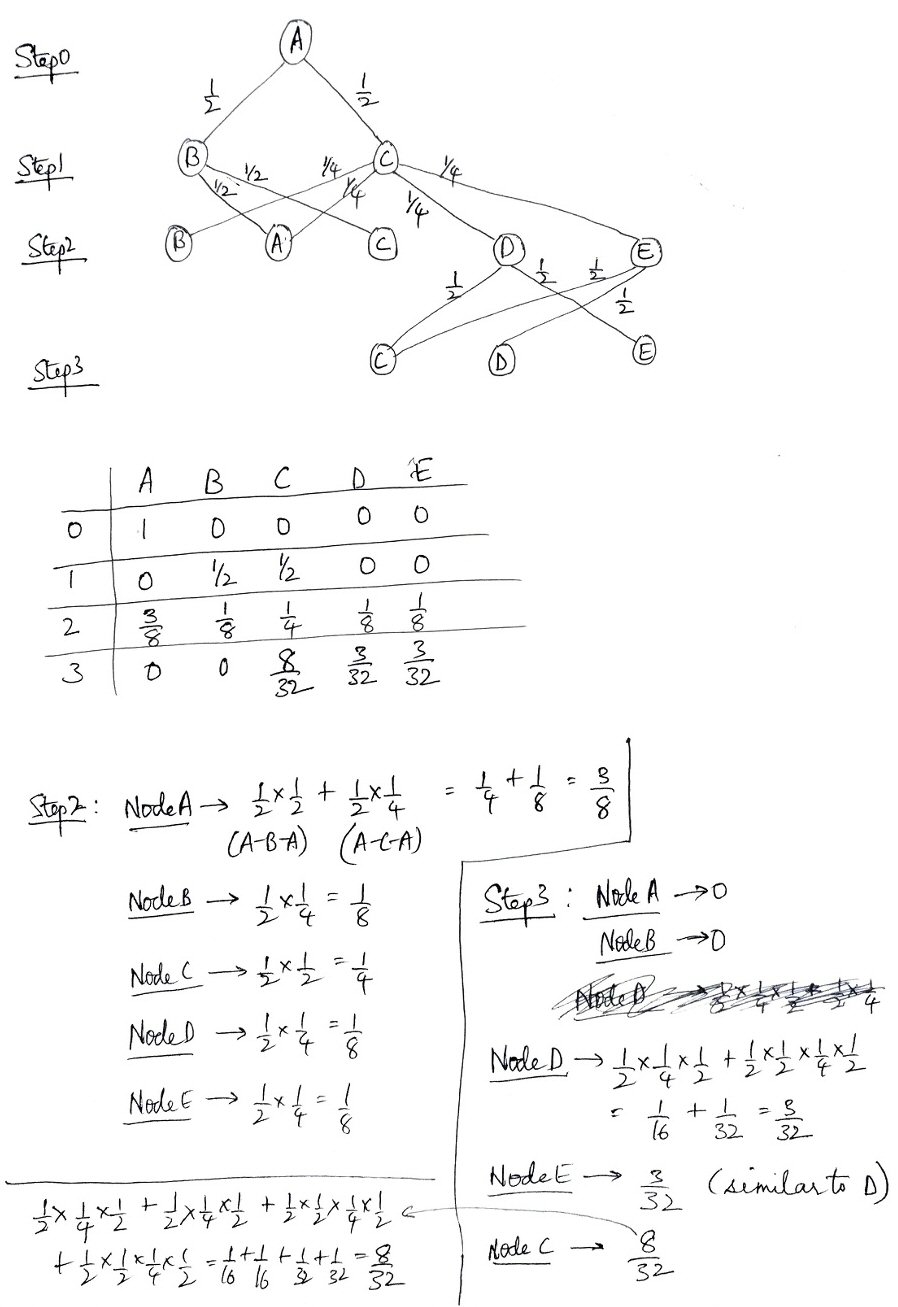
Here we see work from the start all the way to step 3, and a major change in representation. He is now showing each entire path from the start, rather than just working with one step at a time. In particular, he now has a row at each step for all nodes with non-zero probabilities, though those are wrong at step 3, and each arrow is now labeled only with the probability at that step, not the cumulative probability. The latter change is one I consider helpful; the former perhaps overcomplicates things – but in the process, we can better see how he is thinking!
I replied:
Thanks. Now we have something to talk about. Your answers for step 3 are wrong, but you’ve given me some questions to ask.
First, you have invented one of the alternative representations of the work that I had considered, namely rewriting the network in a way that shows all possible motions. The trouble is, though you nicely show the relevant part for step 2, you didn’t show all of it for step 3.
In using that method, I would want to put ABCDE on one line, and another copy of ABCDE on the next line, and then show all possible paths from each node at one step to any nodes in the next step. It would look like this:
Now we can easily see where we can get to from each node, and we can assign a probability to each path. Then to get the probabilities for the next step, we just multiply the probability of being at each node already, times the probability of each path, then add those up to get the new probability for each node.
This new representation, used as I described here, will allow us to flatten the whole process, using the very same diagram repeatedly for each step. If Chethan had drawn two complete rows, he would have seen this. (Of course, this diagram has so many arrows it would be impossible to label each arrow, so we’ll have to move to a table format.)
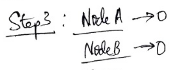
Now I have to ask for your thinking at some points in your work. In step 3, you say you can’t get to A or B at all:
Can you tell me why you say that? You can always go to A from B or C, and to B from A or C. I suspect this indicates some basic misunderstanding of the meaning of the graph.
I was wondering if he didn’t fully understand that this is an undirected graph, on which you can go both up and down.
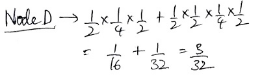
Next, for D you added two terms, though your drawing only shows one path:
And the second of these shows four factors, whereas anything at step 3 should have three factors. What does that second term represent? You do something similar for C.
We won’t get to see the reason for this wrong work, which could be just a typo or something deeper.
Now I dealt with the fact that Chethan is looking at each entire path, rather than just the changes from one step to the next:
Now, I wouldn’t go back to the start for each path; instead, I’d start with the already-calculated probabilities for one step and just multiply each of those as appropriate for the next step, so I’d have a sum of products of only two fractions for each term. But what you did helped me see better what you are thinking.
And in order to make the work easier, I would observe that each step is obtained from the step before in the same way. For example, if A represents the prior probability of being at A, and so on, then the new probability of being at A would be 1/2 B + 1/4 C. This makes a recursive formula that I can fill in for each step with very little new thought.
I’m glad that you didn’t just take the method I suggested, but instead thought for yourself. I hope these ideas help you move further. The sort of ideas I’m talking about illustrate how you think through a new problem, and invent notations and techniques for solving it.
The idea of a recursive process, where we do exactly the same calculations at each step, is key to the whole idea of the problem.
The solution
Chethan responded,
Are these Probabilities correct?
If yes, please help me with Step 4.
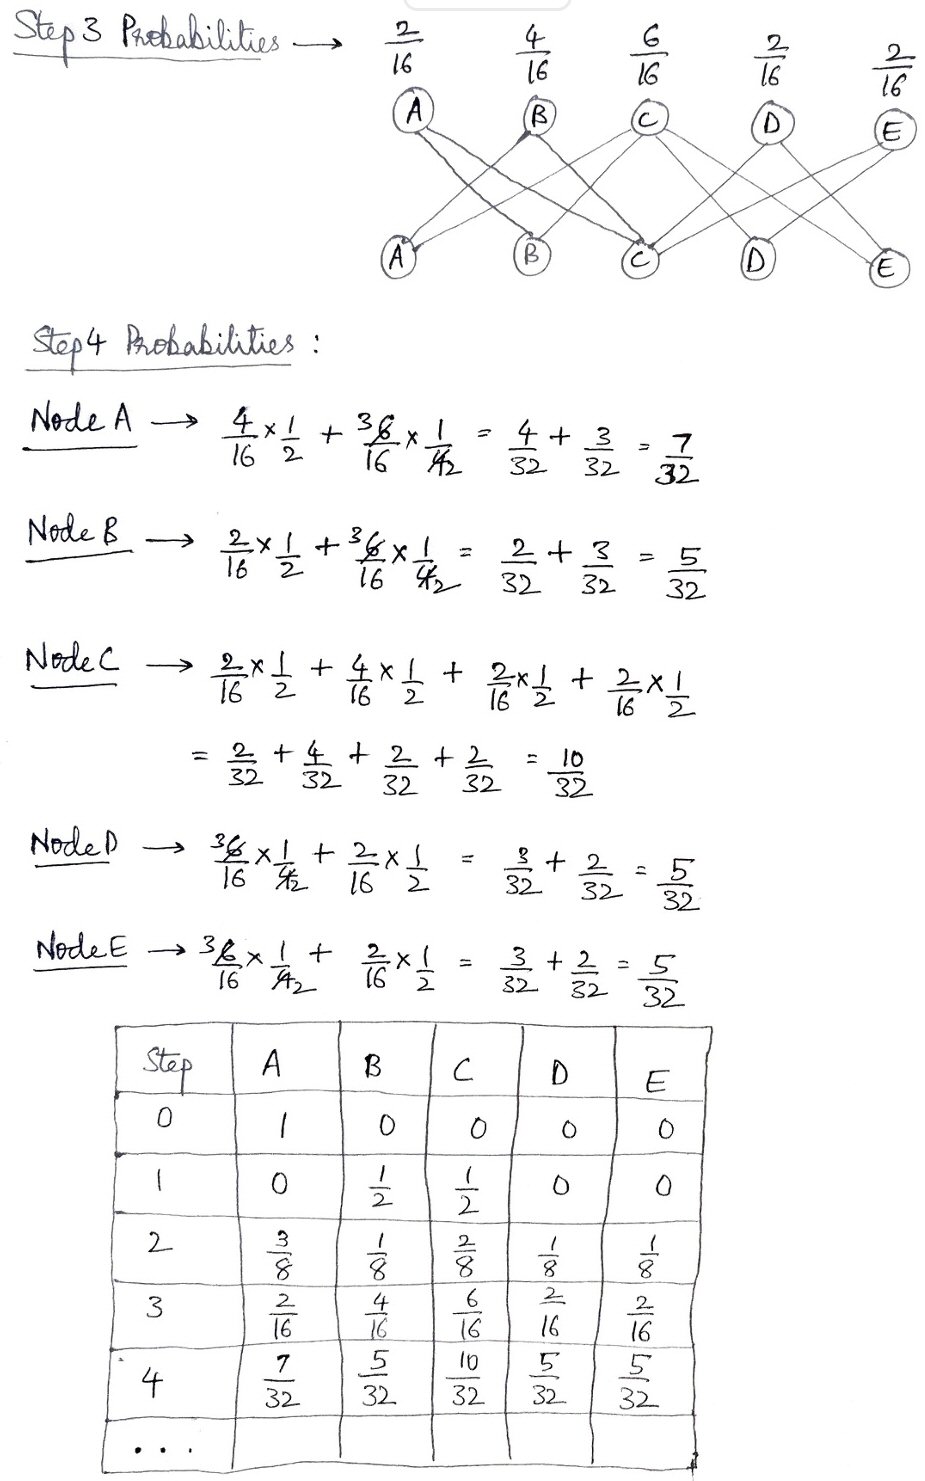
This is exactly what I had in mind; with the work he’s put into trying things on his own, Chethan was well prepared for the new method. A few minutes later (it was the middle of the night for me), he added,
I even tried Step 4.
Is it correct?
It is indeed! I answered,
Both are good. (I first checked by seeing that each row sums to 1; then compared to a spreadsheet I made yesterday.)
I think you’ve got it.
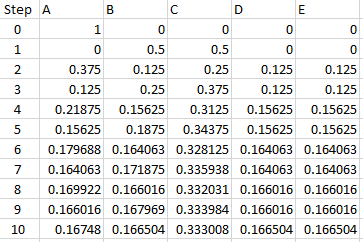
If you write the probabilities as decimals, you can see the limiting distribution a little more clearly, especially by row 5 or 6.
Chethan replied,
Thanks for your help.
I couldn’t have solved without your support.
Taking it further
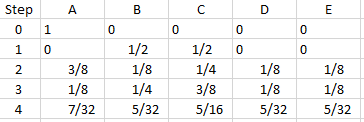
I mentioned a spreadsheet; this implemented the recursion, making each row from the one before like this:
Step
A
B
C
D
E
0
1
0
0
0
0
1
=C2/2+D2/4
=B2/2+D2/4
=B2/2+C2/2+E2/2+F2/2
=D2/4+F2/2
=D2/4+E2/2
The result for the first four steps (displayed as fractions) looks like
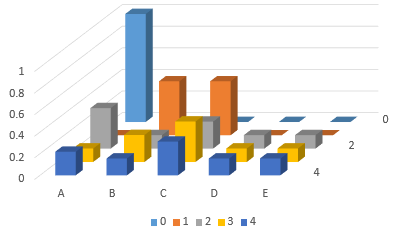
A 3D bar chart shows how the probabilities change from step to step:
At the back we see the starting row, with P(A) = 1; in the front we see the fourth step, with C about twice as likely as each of the others. What happens if we continue for 10 steps?
This makes it clear that the respective probabilities are approaching \(\frac{1}{6}\), \(\frac{1}{6}\), \(\frac{1}{3}\), \(\frac{1}{6}\), \(\frac{1}{6}\), which do, of course, add up to 1. In a later course, or a later part of the same course, this may be proved.