I want to first introduce the concept of piecewise-defined functions, and then explore some often-omitted details raised in some recent questions.
What a piecewise definition means, and how to graph it
We’ll start with a question from December 2022:
Hi there! Hope all is well.
I was wondering how to graph and state the domain and range of piecewise-defined functions. For example, if the workbook gave us the equation
f(x) = {(x + 4 if x <= 1), (1/3x + 1 if x > 1),
then they ask us to graph and state the domain and range. How may we do that?
Thank you.
I answered:
Hi, Firir.
Here is your function:
$$f(x)=\left\{\begin{array}{l}x+4&\text{ if }x\le1\\\frac{1}{3}x+1&\text{ if }x>1\\\end{array}\right. $$
To graph it, you need to first understand what the notation means.
It’s saying that when x ≤ 1, you will graph the equation y = x + 4; and when x > 1, you will graph the equation y = 1/3 x + 1.
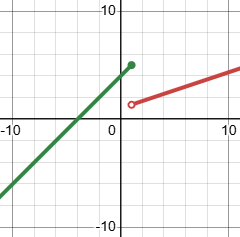
So you could actually draw the entire graphs of those two lines, and then erase all of the first that isn’t where x ≤ 1, and erase all of the second that isn’t where x>1. You’ll make a solid dot at the end of the first line (at x = 1) because that equation applies at that point; and make an open (empty) dot at the end of the second line (again, at x = 1) because that equation does not apply there.
I often suggest that we read the notation from right to left, so this one means,
If \(x\le1\), then \(f(x)=x+4\);
if \(x>1\), then \(f(x)=\frac{1}{3}x+1\).
We can think of this as defining two functions, \(f_1(x)=x+4\) and \(f_2(x)=\frac{1}{3}x+1\), and using only a piece of each of these, as specified by the conditions.
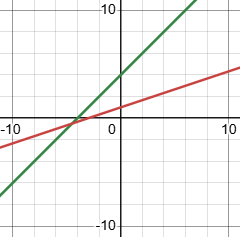
If we graph the first in green and the second in red, then (ignoring the conditions) the graphs look like this:
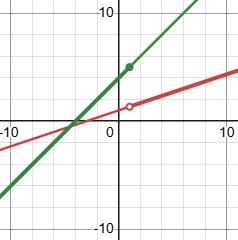
Darkening the parts we want to keep, we have
Erasing the parts we don’t want, we are left with the graph of the function:
But drawing, no matter how lightly, and erasing is a bother:
What I usually do, though, is not to draw and erase; I only draw the parts I need. With a little practice, that will be easier; one useful trick is to always plot the point on each graph at the boundary between the parts, before you draw anything else.
In this case, for the first part (\(x\le1\)), we want to make a dot (solid, because this point is included) at the boundary point where \(x=1\) and \(y=f_1(1)=1+4=5\), namely \((1, 5)\); and a second dot anywhere to the left of that. I’ll pick \(x=-5\) and \(y=f_1(-5)=-5+4=-1\), giving me \((-5, -1)\).
For the second part, we want another dot (this one empty) at the boundary point where \(x=1\) and \(y=f_2(1)=\frac{1}{3}(1)+1=\frac{4}{3}\), that is, \((1, \frac{4}{3})\); and a second dot somewhere to the right of that; I’ll pick \(x=6\) and \(y=f_2(6)=\frac{1}{3}(6)+1=3\), giving me \((6,3)\). (I chose 6 so I could divide it by 3 without fractions.)
This way, I get:
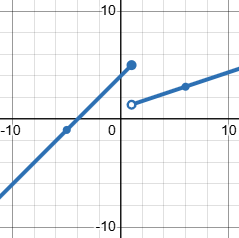
One benefit is that in drawing the lines this way, I don’t need to draw the y-intercept when it is not in the part of the line I need to draw; I just draw a line starting at the boundary point, and through the other point and continuing (with an arrow on the end).
One thing to observe about the graph is that it is not continuous: we have to take our pen off the paper to leap from one value to another at \(x=1\). This is not always true; but sudden changes are natural in piecewise functions.
In fact, that’s what makes piecewise functions essential to describing the real world, where abrupt transitions are common. A graph of the density of the world will show sudden changes as you move from air into a wall, and the speed of a ball will suddenly change when it bounces off the floor. And as I’ve recently been reminded, the time of sunset suddenly changes when we leave Daylight Saving Time! (More on that at the bottom.)
Domain and range, with and without graphing
Now, the question also asked about domain and range:
Now think about the domain, the set of all values of x for which this function is defined. They’ve almost told you that: It will be the union of the domains of the two parts, namely {x | x≤1} and {x | x>1}. What is that set?
The domain of the first piece is 1 and everything to the left, and the domain of the second piece is everything to the right of 1; together, this covers all real numbers. And that’s what we see on our graph, too.
How about the range? That’s the set of all values of y on the graph; and that is the union of the ranges of the two parts. What values of y are in either one or the other?
On the graph, we can see that everything 5 and below is in the range of the first part, and everything \(\frac{4}{3}\) and up is in the range of the second part. Since these overlap, again all real numbers are in the range.
That’s what you can do if you are told to graph the function. If you weren’t, you might still want to do it, in order to see what the function is; but sometimes you can just work out those unions without making the graph.
Without graphing, we would at least want to find the boundary points, and observe that the higher one is a maximum, and the lower one is a minimum (because the slopes are both positive), which tells us what the range will be.
If you aren’t sure of your result (or even if you are, but would like some additional discussion), write back and show me your answers to the problem. And if you have any questions about it, feel free to ask.
Firir never did write back, so we couldn’t discuss this further. Other examples would illustrate different issues.
So let’s do that. We’ll look at a function with more than two pieces, and more interesting domain and range. And we’ll also include non-linear functions.
Three pieces: gluing them together
But first, let’s look at an older question, from Ask Dr. Math in 2001:
Graphing Piecewise Functions

I do not understand how to GRAPH piecewise functions.

Graph:
            {2x        if 0 <= x < 2}
     f(x) = {4         if 2 < x < 4}
            {-1/4x + 5 if 4 <= x <= 6}

I know it is hard to understand what I wrote, but please help me!
Thank you so much.
Mary actually made up her own notation for typing “≤”, namely “<_”; I’ve replaced it with the more traditional form, “<=”.
I answered:
Hi, Mary.

You have the function defined in three parts; you can start by marking the domains of those parts on the graph, by drawing (lightly) the vertical lines x = 0, x = 2, x = 4, and x = 6. Now, again lightly, draw the lines

    y = 2x

    y = 4

    y = -1/4 x + 5
This example would look like this:
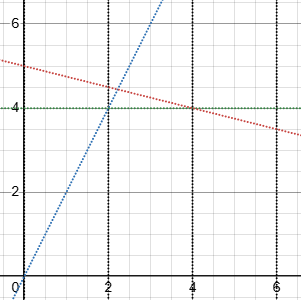
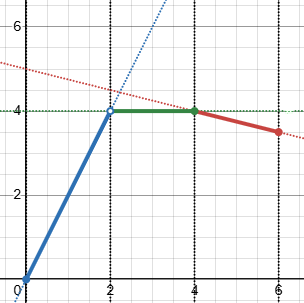
Finally, you have to cut out the pieces that form the given function and glue them together (figuratively). Look in the region 0 <= x < 2, and darken the first line only within that region, that is, between the lines x = 0 and x = 2. Then, in the region 2 < x < 4, darken the second line, and in 4 <= x <= 6, darken the third line. The darkened portions constitute the function f(x), which is therefore defined only on the domain 0 <= x <= 6.
I didn’t explicitly point out, as I should, that we use solid or empty dots to indicate whether endpoints are included; and that in this case, \(x=2\) is missing.
Here is the result, before erasing:
Sometimes I just draw brackets above or below each domain, with the equations, and don’t draw the seam lines:
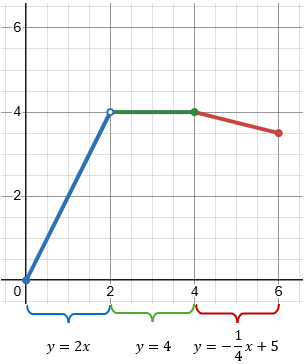
Of course, I don’t usually use different colors.
In this case, you will find that the three segments actually are "glued" together; they meet at x = 2 and x = 4. That isn't always true, but when it is it can help you feel confident.
Technically, it is not “glued” at \((2,4)\), since that point is absent, but the two line segments do meet there!
A more complicated example
Now, suppose we are given this function, with more parts and not just lines:
$$f(x)=\left\{\begin{array}{ll}\frac{1}{2}\left(x+3\right)^2-\frac{3}{2}&\text{ if }-4\le x<-2\\x+1&\text{ if }-2<x<0\\4&\text{ if }x=0\\\frac{1}{4}(x+2)^2-1&\text{ if }0<x<2\end{array}\right.$$
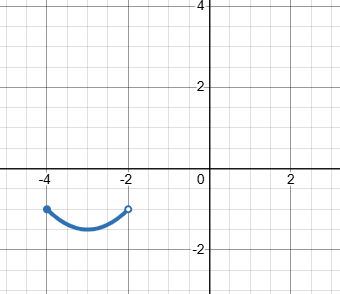
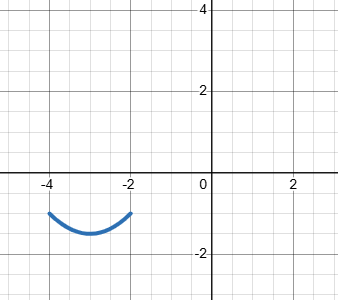
We can graph the first part, \(f_1(x)=\frac{1}{2}\left(x+3\right)^2-\frac{3}{2}\), by observing that it is a parabola with vertex at \(\left(-3,-\frac{3}{2}\right)\), and at the left and right ends of its domain, respectively, \(y=f_1(-4)=\frac{1}{2}\left(-4+3\right)^2-\frac{3}{2}=-1\) (included), and \(y=f_1(-2)=\frac{1}{2}\left(-2+3\right)^2-\frac{3}{2}=-1\) (excluded):
The second part, \(f_2(x)=x+1\), is just a straight line from \(y=f_2(-2)=-2+1=-1\) (excluded) to \(y=f_2(0)=0+1=1\) (excluded):
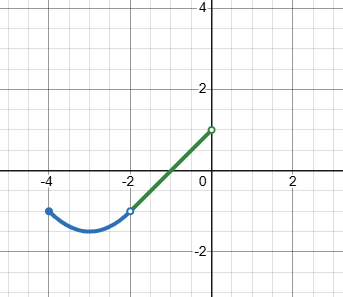
Notice that there is no definition for \(x=-2\), so we are left with a hole there.
The third part is just a single point at \((0,4)\):
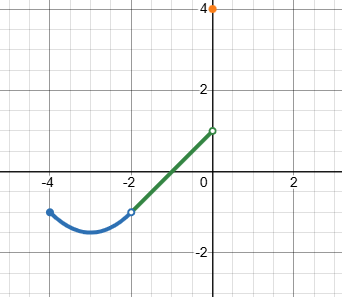
The last part, \(f_4(x)=\frac{1}{4}(x+2)^2-1\), is a parabola with vertex at \((-2,-1)\), which is not in the region we’ll be graphing, so we can just plot a gentle upward curve between the two endpoints, \(y=f_4(0)=\frac{1}{4}(0+2)^2-1=0\) and \(y=f_4(2)=\frac{1}{4}(2+2)^2-1=3\) (both excluded):
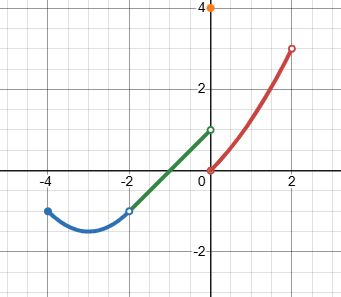
Here we have a momentary leap from almost 1 on the left of \(x=0\) to 4, then a drop to 0 on the right; this is a jump discontinuity. That’s something piecewise functions permit, though it doesn’t always happen.
If you want more accuracy, you could either plot an extra point, such as \(y=f_4(1)=\frac{1}{4}(1+2)^2-1=\frac{5}{4}\), or very lightly sketch (or at least imagine) a larger part of this function, using knowledge of its vertex, and only actually draw the part we want:
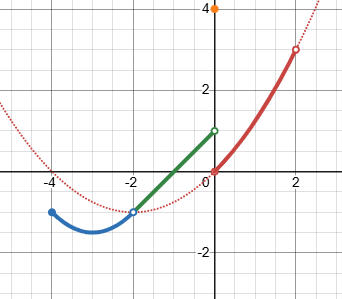
Now, what is the domain? The function is defined starting at \(-4\) (included) up to \(2\) (excluded), but also excluding \(-2\), so the domain is \([-4,-2)\cup(-2,2)\).
The range extends from the lowest value, \(y=f_1(-3)=\frac{1}{2}\left(-3+3\right)^2-\frac{3}{2}=-\frac{3}{2}\) (included) up to \(3\) (excluded), together with the isolated value \(4\), so the range is \([-\frac{3}{2},3)\cup\{4\}\)
That covers most of the ideas you’ll encounter.
I should mention that this sort of example is intended only to give you exercise with everything that can happen, not to represent any actually meaningful function.
Graphing in Desmos
Incidentally, my graphs above were made with Desmos, mostly using its domain restriction capability to graph a line over a restricted interval, like this: $$y=\frac{1}{2}\left(x+3\right)^{2}-\frac{3}{2}\left\{-4\le x<-2\right\}$$
It also has a direct way to write piecewise functions, which for our example looks like this:$$y=\left\{-4\le x<-2:\frac{1}{2}\left(x+3\right)^{2}-\frac{3}{2},-2<x<0:x+1,0<x<2:\frac{1}{4}\left(x+2\right)^{2}-1\right\}$$
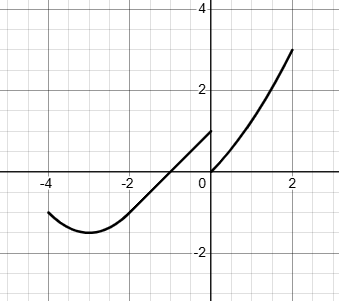
But note that it doesn’t include dots at endpoints (or isolated points or holes); you have to add those separately:
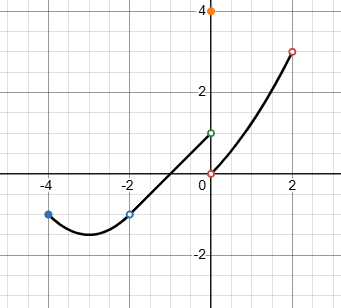
(You would probably want to make the points the same color as the rest.)
The conditions should not overlap
Now consider this question from this September:
Hi Dr Math,
I have the question below and my solution. I want to ask if I can put the greater or equal sign in the bottom branch.
To have ≤, ≥ in the branch point?
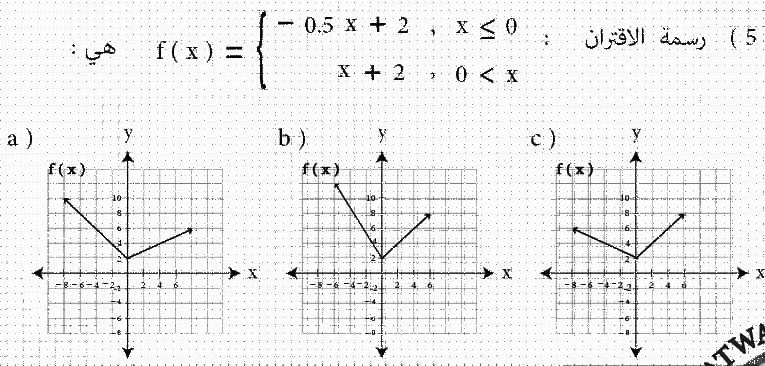
One thing you may notice about this is that the conditions are written with just a comma in place of the word “if” (others might say “for“); there are many variations on that. Also, the second condition is written as \(0<x\) rather than \(x>0\), which puts everything in left-to-right order. That’s just a matter of taste.
The instructions appear to say to pick the graph that matches the function. Looking at the function, we see that the first slope is \(-\frac{1}{2}\), and the second is 1; only graph (c) agrees with this. Amia’s question is not about that, but about whether it would be legal to write the second condition as \(x\ge0\).
Hi, Amia.
I assume your answer is (c).
If you were asked to write a piecewise equation for that graph (reversing the problem), you could choose to write each equation and each condition in several ways, and you could choose to include equality in either part of the piecewise definition, but not both.
This is merely because of tradition: We want to define the function in such a way that it is defined only once for each value. If we allowed a point to be included in two different regions, then it would be necessary to check for inconsistency (to make sure it is actually a function), and we don’t want that.
That is, if we wrote the function as $$f(x)=\left\{\begin{array}{ll}-0.5x+2&\text{ if }x\le0\\x+2&\text{ if }x{\color{Red}{\ge}}0\\\end{array}\right.$$ then we would have to wonder whether the two cases give the same value at \(x=0\).
For example, if our first problem above had said, $$f(x)=\left\{\begin{array}{ll}x+4&\text{ if }x\le1\\\frac{1}{3}x+1&\text{ if }x{\color{Red}{\ge}}1\\\end{array}\right.$$ we would observe that \(f_1(1)=1+4=5\), but \(f_2(1)=\frac{1}{3}(1)+1=\frac{4}{3}\), and since these are not equal, it would not be a well-defined function. It’s mostly politeness that leads us to save the reader that concern (though he will still want to do that check if he wants to know whether the function is continuous).
For example, Wikipedia says,
In mathematics, a piecewise function (also called a piecewise-defined function, a hybrid function, or a function defined by cases) is a function whose domain is partitioned into several intervals (“subdomains”) on which the function may be defined differently.
That word “partitioned” means divided into subsets that do not overlap:
a partition of a set is a grouping of its elements into non-empty subsets, in such a way that every element is included in exactly one subset.
Writing the definition as you suggest would not lead to any problems; it just would not be considered a valid piecewise definition.
Similarly, there are things we in English say can [sic!], which although we can understand what was intended, are grammatically incorrect, and risk misunderstanding.
A piecewise definition in one line?
In August, Amia had asked a different question:
Hi Dr Math,
Is this function a piecewise function?
f(x) = x^2, x > 1 and x < 1
Presumably this means that the function is defined as \(x^2\) for numbers greater than 1, and also for numbers less than 1.
I answered:
Hi, Amia.
Yes, it is a piecewise function – by definition!
I personally prefer the term “piecewise-defined function”, because it is not really about a kind of function, but a way of stating the definition of a function. If the way you choose to define a function uses more than one piece, then it is a piecewise definition.
For example, the function $$f(x)=2x+1$$ is not defined in terms of pieces, but it can also be expressed as $$f(x)=\left\{\begin{array}{ll}2s+1&\text{ if }x\le1\\2x+1&\text{ if }x>1\end{array}\right.$$ which is a piecewise definition, though the function itself is not inherently “piecewise”.
The function in the question is written in a slightly odd way, but clearly does identify two parts, which is why I said that, “by definition”, it is defined piecewise.
I checked with Wikipedia, and they say the same thing:
Piecewise definition is actually a way of specifying the function, rather than a characteristic of the resulting function itself, as every function whose domain contains at least two points can be rewritten as a piecewise function.
For example, we can write the absolute value function in piecewise form, though when we write |x| we are stating the same function in one piece.
That is, the function $$f(x)=|x|$$ can be expressed as $$f(x)=\left\{\begin{array}{ll}x&\text{ if }x\ge0\\-x&\text{ if }x<0\end{array}\right.$$ The latter is a piecewise definition, the former is not, though they represent the same function.
On the other hand, your example, which I am reading as
f(x) = x2, x > 1 or x < 1
(since there is no value of x that is both greater and less than 1!) has been written in a non-standard way on one line, and it really means
f(x) = { x2,  x > 1
       { x2,  x < 1
which clearly consists of two pieces; and your use of “and” clearly shows that you were thinking this way (“the first line and the second line”).
The use of “and” and “or” in mathematics is a common point of confusion; we discussed it in The Difference between And and Or on Ask Dr. Math (make a free account to view it). If we say something is true when \(x<1\) and \(x>1\), we mean when x is a number that is both less than and greater than 1. Of course, no number is both! But when we say it is true when \(x<1\) or \(x>1\), we mean a given value of x may be either less or greater.. That is, it is true in both cases (which is why one can accidentally say “and”).
The point is that the definition explicitly mentions two “pieces”, so it is a piecewise definition.
But you could write it in a non-piecewise form, as a mere domain restriction:
f(x) = x2, x ≠ 1
But since, as I said, the term is really just about how you choose to write the definition, who really cares?
If anyone disagrees with me, it makes no difference at all. I would not argue back.
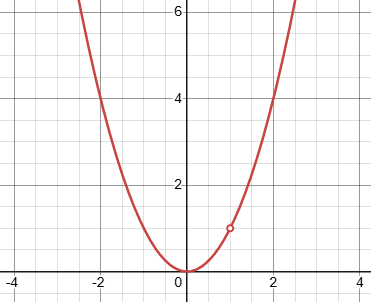
In Desmos, all of these look like
A real example: sunrise times
I mentioned that Daylight Saving Time gives us a real-life piecewise function with jumps. Here is a graph I made (by modifying a spreadsheet supplied by NOAA – a formula would be very complicated!) of sunrise and sunset times for my location:
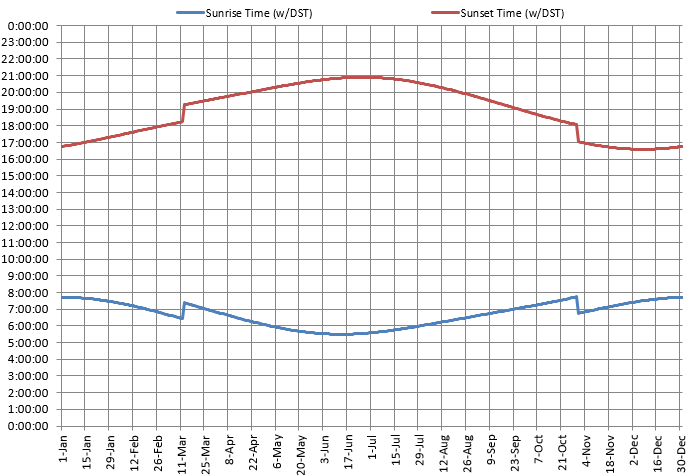
You can see that the latest sunset this year was Halloween night, just before reverting to standard time; without DST, the range of the sunrise function would be an hour greater (too late in winter with permanent DST, too early in summer with permanent standard time).
While the name implies DST is intended to give us “more daylight”, that really means to transfer daylight from the morning in summer, when it is too early for us to use, to the evening. It is the morning that really determines when it’s helpful to add an hour (in addition to wanting to still have that extra evening hour at Halloween!). How much benefit that provides depend on location. Unfortunately, the jump is harmful for humans whose bodies struggle to adjust, and the mere piecewise nature of DST is harmful for anyone who cares about real time (such as farmers, and astronomers – animals and stars know nothing of DST).
My personal solution to the time-change problem is to drop DST altogether, sticking with logical standard time (by which noon has a meaning in terms of the sun), and adjust the local culture to get up earlier in the summer to use that sunshine well. This is essentially what Benjamin Franklin proposed.