
(A new question of the week)
We often see polynomials in a simplistic way, imagining that any function whose graph resembles a polynomial is a polynomial. Much as an attempt to mimic random data often lacks essential properties of genuine randomness, so what we intend to be a polynomial often is not. As we observe more polynomials, we can start to recognize more of the constraints to their shapes; but even teachers can sometimes design problems that are not quite what they seem. Here I will analyze a graph to death, pointing out what it is not, before answering the question as it was presumably intended.
Here is the question, sent in by Randy in the last day of July:
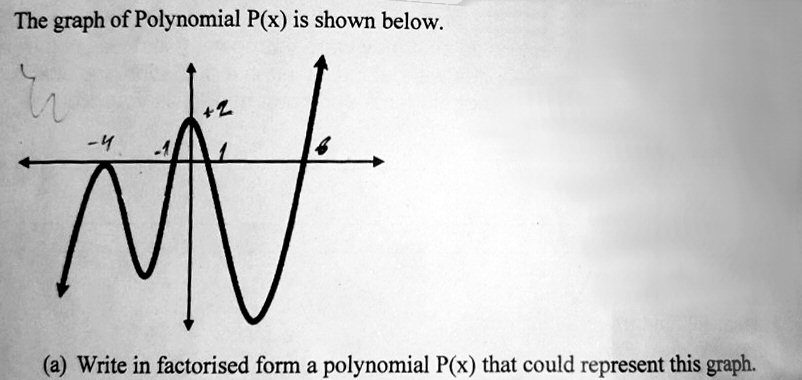
How can I write a Polynomial that can represent the graph below?
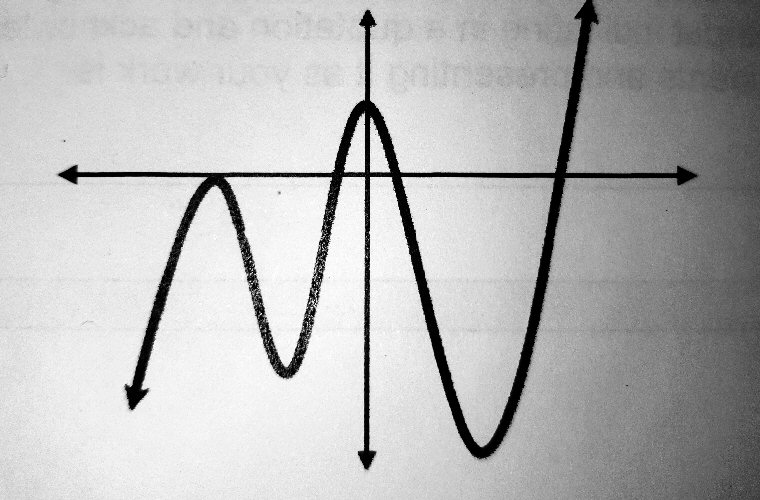
This looks very much like a polynomial; yet I could recognize from experience that it was probably hand-drawn in some sense, not made by actually graphing a polynomial. It just looks a little too tame. I decided to take this as an opportunity to “play”, experimenting with this open-ended question and taking it further than was surely intended, to check my intuition.
In particular, I observed that the phrase “can represent” is ambiguous. How accurate must the representation be? What if there is no polynomial that actually does represent the graph?
Matching the degree
I answered:
Hi, Randy.
That depends on exactly what you hope to do! I hope you’ll tell me the context of your question, whether it’s an assignment or just a matter of curiosity. Meanwhile, I’m going to have fun with it.
Since no coordinates are shown, you may just mean, how could you write a polynomial whose graph would look generally like that, with two local maxima and two local minima. It is easy to see the minimal degree for such a polynomial.
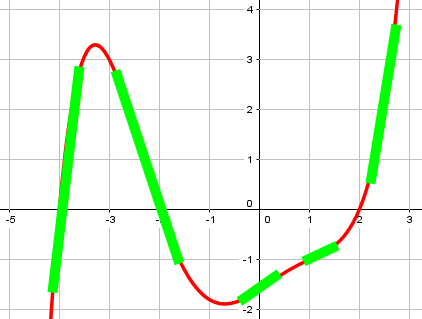
Since the graph changes direction 4 times, and can be seen as 5 segments going up-down-up-down-up, its degree would have to be at least 5. We could make something like this by writing 5 factors corresponding to 5 zeroes more or less evenly spaced, scaling it so it fits, and perhaps shifting it up or down a little. Here, for example, is the graph of $$f(x)=\frac{1}{10}(x+4)(x+3)(x+1)(x-1)(x-2)\\=\frac{x^5+5x^4-3x^3-29x^2+2x+24}{10}$$
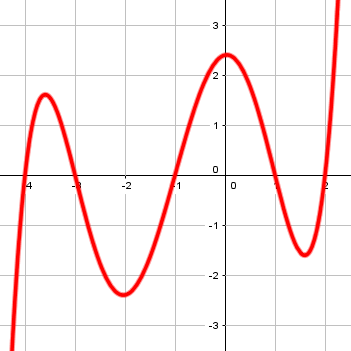
Shifting this down about 1.6 would make it look a lot like our goal.
Here are the five segments I imagine when I see it, which suggest degree 5:
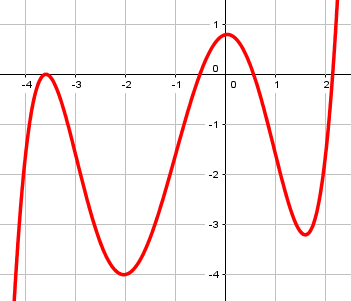
Not all polynomial graphs are quite so clear-cut; this is more typical: $$g(x)=\frac{1}{30}(x+4)(x+2)(x^2-2x+3)(x-2)\\=\frac{x^5+2x^4-9x^3+4x^2+20x-48}{30}$$
There the segments are more subtle, because the change of direction between them is not always from up to down; the slope just alternately decreases and increases:
Anywhere, here’s what we get by shifting my function down:
Matching intercepts
But probably a little more is expected:
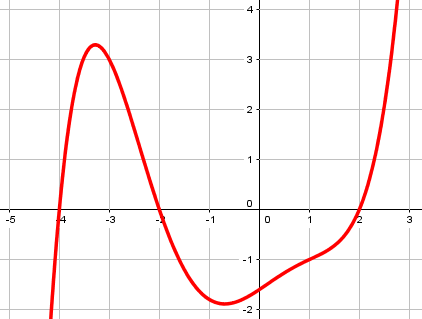
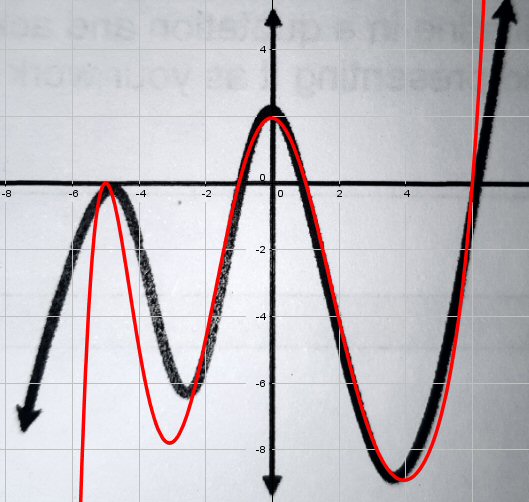
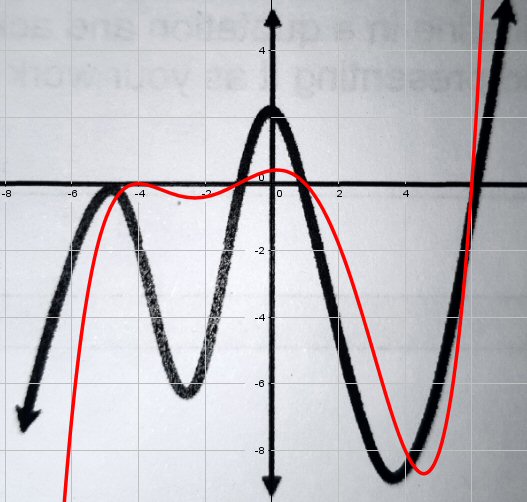
Or, you might want to estimate the x- and y-intercepts and write a polynomial using the appropriate factors. If you do that, though, you’ll find that a polynomial of minimal degree that has these intercepts doesn’t really match the graph. Here is what I get using GeoGebra:
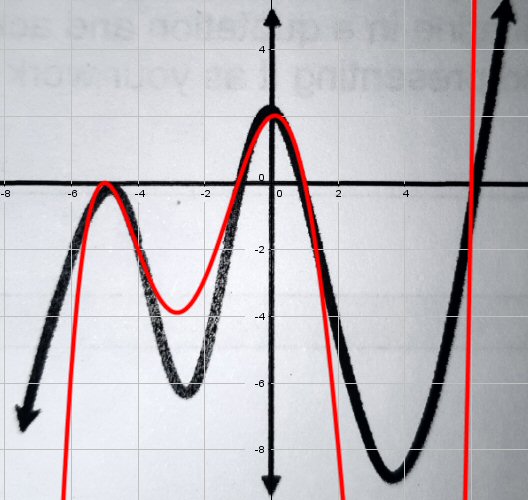
Here I used the given graph as a background image in GeoGebra, adjusting its size so that the zeros were approximate integers (-5 with multiplicity 2; -1; 1; and 6), and then graphed a polynomial with those intercepts, namely $$f(x)=\frac{1}{75}(x+5)^2(x+1)(x-1)(x-6)\\=\frac{x^5+4x^4-36x^3-154x^2+35x+150}{75}$$ I chose to divide by 75 in order to adjust the vertical scale so that the y-intercept would be 2, rather than 150.
The relative minimum near \(x=4\) is far too low.
If I adjust this (by dividing by a constant) to make it fit in the grid, I get this:
Many textbooks give the false impression that any polynomial-like curve is just what it looks like. But our general impression tends to be wrong.
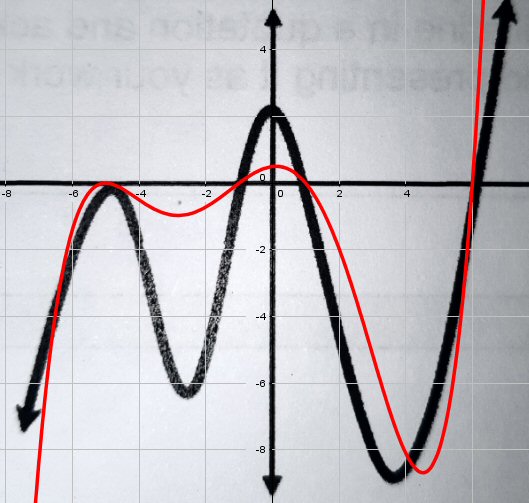
That is the graph of $$f(x)=\frac{1}{300}(x+5)^2(x+1)(x-1)(x-6)=\frac{x^5+4x^4-36x^3-154x^2+35x+150}{300}$$
So, why is this so far from fitting the heights of the relative extremes? The problem is that a fifth-degree polynomial only has six parameters to adjust (either the coefficients in expanded form, or the zeros and the constant multiplier in factored form). Once we’ve chosen the intercepts, we have no more freedom to adjust individual heights; we have to take what we get. To put it another way, adjusting horizontal features (the x-intercepts) entails vertical features (slopes and extremes) in ways we can’t control.
Trying a higher degree
Could we use a higher degree, with more parameters, and get closer? I’m sure that isn’t what was intended, but …
Just for fun, I tried multiplying this polynomial by a quadratic and manually adjusting the coefficients (using sliders in GeoGebra) to try to get a better fit. Here is the best I could do:
That has degree 7.
Its equation is $$f(x)=\frac{1}{300}(x+5)^2(x+1)(x-1)(x-6)(0.1x^2-1.1x+3.9)\\=\frac{x^7 – 7 x^6 – 41 x^5 + 398 x^4 + 325 x^3 – 6241 x^2 – 285 x + 5850}{3000}$$ Because the quadratic I multiplied by has no real roots, this didn’t change the intercepts, but did warp the overall shape in subtle ways (similar to what we saw in my second quintic graph above, but even more subtle). Yet it couldn’t reduce the slope of the outer parts, where the real polynomial shoots up and down far more steeply than we expect.
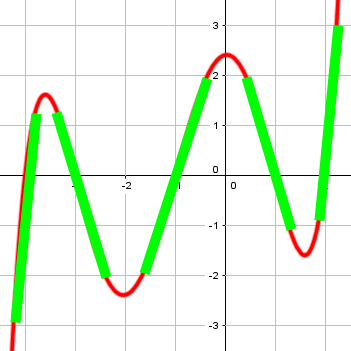
To do better, we could identify a few more points on the graph and plug them into, say, a general degree-11 polynomial and solve for the coefficients; but that’s actually worse (here using GeoGebra’s FitPoly function and the points in green):
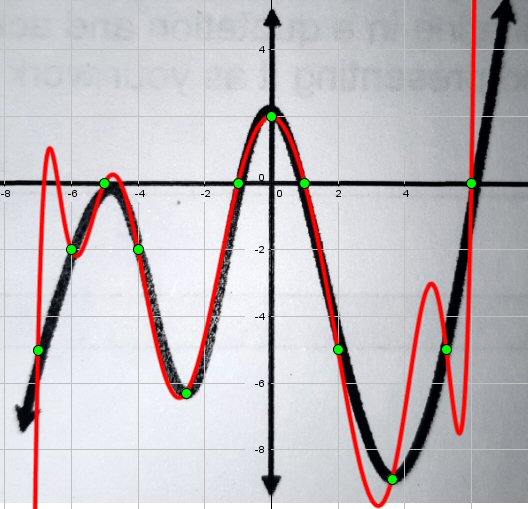
If you try to squeeze a polynomial to fit the shape you want, it pops out in other places!
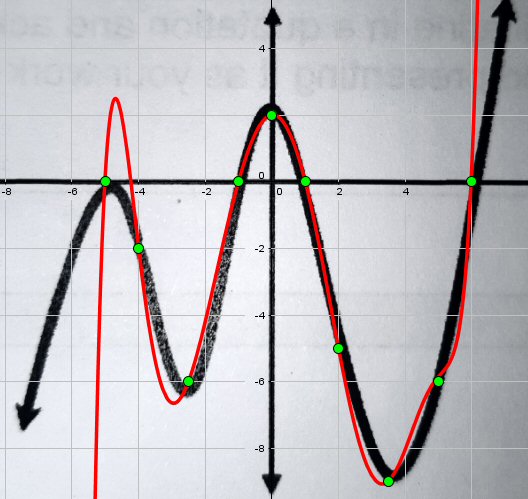
As an alternative, I entered ten of those points into a spreadsheet (because the highest degree it could handle is 9) and made a polynomial trendline; here is what it gave, a little better than GeoGebra’s:
$$\frac{0.3004x^9-1.04921x^8-13.0611x^7+11.9431x^6+179.65x^5+1125.12x^4-1307.43x^3-21135.9x^2+1140.54x+20000}{10000}$$
Other attempts using a different set of points made the match far worse.
If I really wanted to get it right, I’d use the derivative at the turning points, as well as the function values; but I’d have to do that manually, and since I’m doing this “just for fun”, I’m not going to try just yet!
The point I’m really making is that any squiggle you make that looks like a polynomial to you, is probably a whole lot more complicated than you realize!
When you tell me what the actual goal is, we can discuss more details or what you might actually be expected to do.
All of this is to say that when I write a problem like this, I am careful to provide the graph of the actual polynomial I want as an answer, even if I don’t demand that the answer be exact. I don’t want students to do the right work, but then waste time struggling to decide whether the differences they find between the graph of their function, and the graph I provided, are enough to make their answer wrong. I don’t want to ask what function “could” have this graph, when in fact no polynomial actually does.
But we need to move on to the intended meaning of an imperfect problem. I had intentionally not given the equations I was graphing, so Randy would have work to do, even after I’d demonstrated the possibilities.
Answering the intended question
Randy replied the next morning with an attempt, showing he understood the main ideas, at least:
After hours of thinking, I got f(x) = 1/20 (x + 4)^2 (x+0.01) (x-2) (x-5).
Is this a valid answer?
The only thing that is really questionable about this is the unexplained number 0.01.
I answered,
If all you want is the same general shape (as in my initial comment), then yes. Here is the graph, which looks quite good in that respect:
It does have the right number of ups and downs; but it has zeroes at -4 (with multiplicity 2), -0.01, 2, and 5, rather than a peak at 0; and the y-intercept is 0.08. (I rescaled the image to match his choice of -4 and 5 for the first and last zeros.)
You (or your teacher?) have to define what you consider to be a valid answer, since as I showed, you aren’t going to get an exact match. Does it have to have a peak at x=0, for example?
Since there was no scale, you don’t have to use the same numbers I show for intercepts, but I would expect not to have an intercept so close to 0. For my functions, I used x-intercepts -5, -1, 1, and 6, having scaled the graph to put all the intercepts approximately at integers, but otherwise probably did the same sort of thinking you did.
Was this an assigned exercise? How was it worded, exactly? What topics were most recently discussed? Are you allowed/expected to use a grapher like my GeoGebra, or Desmos?
Since his main error seemed to be the use of 0.01 instead of -1, I stated the intercepts I used; the most important piece of the exercise is in using those, not choosing them.
I was hoping that something in the context would give us a clearer idea of what constitutes a satisfactory answer. I expected the zeros to be the main concern, but if the context were calculus and there had been numbers on the axes, more might be demanded.
Randy replied with the entire problem:
That’s the question I got.
The zeroes he wrote in are similar to mine, and not what he used for his equation.
But we never learned what part (b) is, which could be interesting.
I answered:
The word “could” is probably intended to acknowledge that your answer only needs to match the basic visible features, without needing to exactly match, which is good.
The numbers you added to it for intercepts more or less agree with mine; use those, and you should be good.
The only things about your answer of f(x) = 1/20 (x + 4)^2 (x+0.01) (x-2) (x-5) that don’t fit are the specific numbers 0.01, 2, and 5 (only the first of these being definitely wrong), and the value of f(0).
So use your numbers -4, -1, 1, 6 instead of -4, -0.01, 2, 5; and then redo the calculation of the multiplier to obtain the y-intercept.
Using his intercepts, and setting the vertical scale to agree with the relative minimum, we get the equation $$f(x)=\frac{1}{240}(x+4)^2(x+1)(x-1)(x-6)$$ which looks like this:
That was probably acceptable, given the vague statement of the problem.
Addendum: The roller coaster problem
The next day, we got a question from Charli that raises a similar issue. This discussion didn’t go very far (in part because this is a graded assignment, so we only gave general suggestions, and also because she never read our last reply), but the problem was to write a polynomial for a given curve:
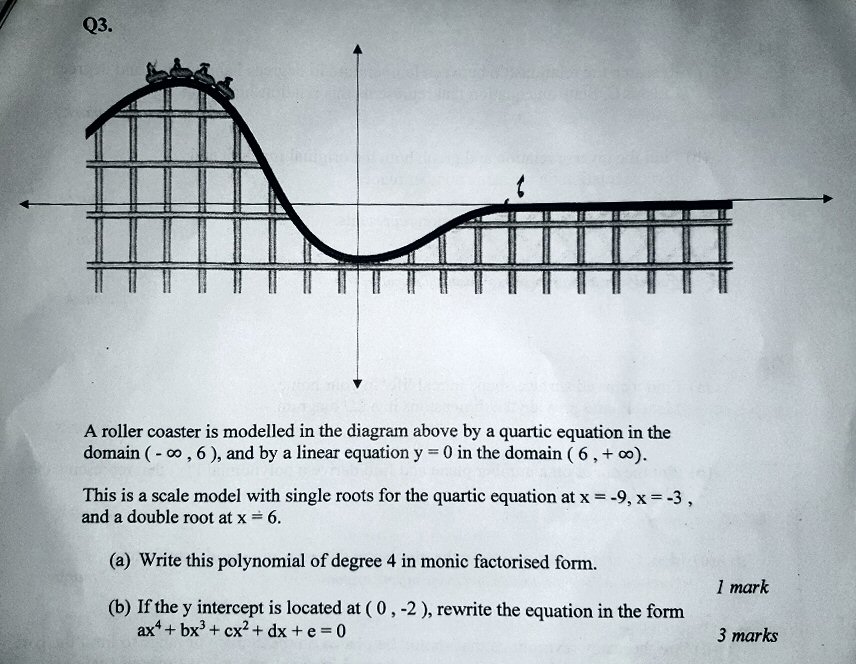
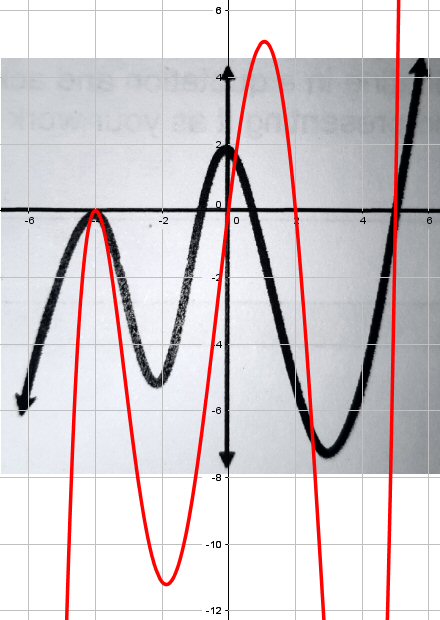
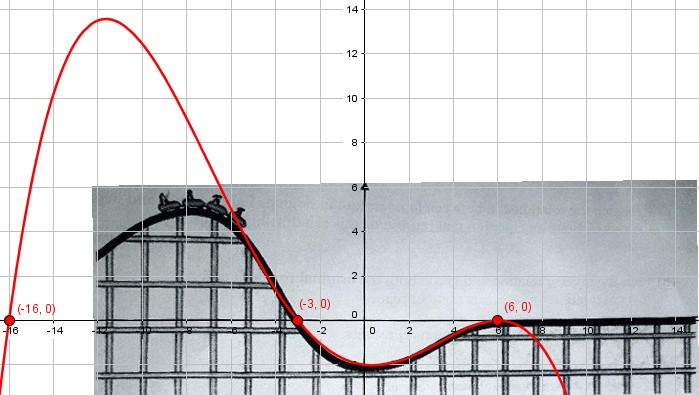
This doesn’t actually say that our polynomial should match the picture, but it’s implied. What we are told to do is to write a polynomial given specified intercepts. The answer to (a) is $$f(x)=(x+9)(x+3)(x-6)^2$$ This takes the x-intercepts into account, but not the y-intercept. (A monic polynomial is one whose leading coefficient is 1.) Since for that function \(f(0) =972\), in order to make \(f(0)=-2\) we need to change the sign and divide by 486: $$f(x)=-\frac{1}{486}(x+9)(x+3)(x-6)^2$$ Here is the graph of that function, superimposed on the picture:
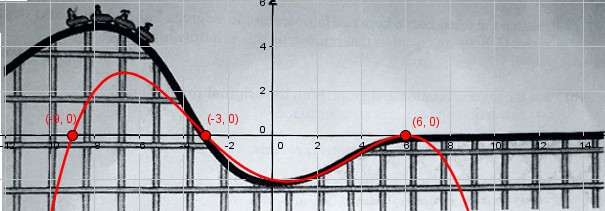
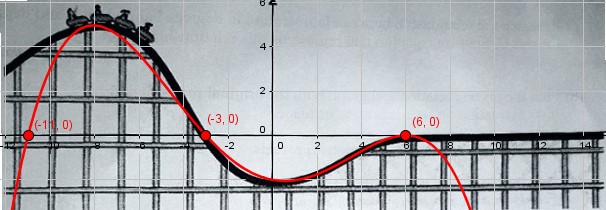
That mostly fits the lower part, but totally misses the upper part – if for no other reason, just because the intercept at \((-9,0)\) is totally wrong. If we estimate that the leftmost intercept should have been about -16 rather than -9, we get $$f(x)=-\frac{1}{864}(x+16)(x+3)(x-6)^2$$ which looks like this:
Not quite, though it does fit the lower part better! Here is perhaps the best we can do: $$f(x)=-\frac{1}{594}(x+11)(x+3)(x-6)^2$$
So although the problem as stated is easy, the picture is not really quite right. In general, not every roller coaster you want to make can be described as a polynomial!
Just as the next part of the problem presumably asks for the piecewise function that includes the straight segment, a real model would use yet a third piece for the top part. And we would choose that function by matching the slopes, not just location, at the point where they meet. And that would make this a calculus problem.